To JSON or not to JSON

How to simply convert a sqlite database to JSON

Last week my collegue Matteo (aka pupunzi) was porting an iPad application (booo!) to HTML5 (yeah!).

The iPad application was a virtual museum that was using a sqlite dabatase for reading data relative to rooms, biography, history and so on.

Even if sqlite is internally supported by some browsers (e.g. Chrome) the easiest way to read data in javascript is to have a JSON object.

I wrote a simple java code to dump the whole database into a JSON object.

import net.sf.json.JSONObject;
import net.sf.json.JSONArray;
import java.sql.*;
import java.util.List;
import java.util.ArrayList;
import java.io.FileOutputStream;
public class DB2JSON {

  public static void main(String[] args) {

    if (args.length<1)
      return;
    Connection conn = null;

    try {
      String dbFile = args[0];
      JSONObject ret = new JSONObject();
      Class.forName("org.sqlite.JDBC");
      conn = DriverManager.getConnection("jdbc:sqlite:" + dbFile);
      Statement stat = conn.createStatement();

      ResultSet tables = stat.executeQuery("SELECT name 
         FROM sqlite_master 
         WHERE type='table' ORDER BY name;");
      List tableNames = new ArrayList();
      while (tables.next()) {
        tableNames.add(tables.getString("name"));
      }
      tables.close();

      for (String tableName : tableNames) {
        JSONArray jsa = new JSONArray();

        ResultSet rows = stat.executeQuery("select * from " + 
           tableName + ";");

        while (rows.next()) {
          JSONObject row = new JSONObject();
          ResultSetMetaData meta = rows.getMetaData();
          for (int i = 1; i <= meta.getColumnCount(); i++) {
            row.element(meta.getColumnName(i), rows.getObject(i));
          }
          jsa.add(row);
        }

        rows.close();
        ret.element(tableName, jsa);
      }

      conn.close();

      // result on console
      System.out.println(ret.toString());

      //result on file
      FileOutputStream fos = new FileOutputStream(dbFile+".json");
      fos.write(ret.toString().getBytes());
      fos.close();     

    } catch (Throwable e) {
      try {
        if (conn != null)
          conn.close();
      } catch (SQLException s) {
      }
      e.printStackTrace();
    }
  }
}

The resulting JSON object will have a property for each table containing an array of records. Different types of properties are supported (String, int, long, dates etc.)

There are two dependencies to external libraries:

  1.  http://json-lib.sourceforge.net/
  2. http://www.zentus.com/sqlitejdbc/

Enjoy.

P.S.: the pupunzi’s porting result is an HTML5 application that runs everywhere and it is looks even more beautiful than the iOS one Smile !

Tassellate: playing on CANVAS

Tassellate: playing on CANVAS

I’ve enjoyed so much playing on HTML5 <CANVAS> that now I cannot stop…


(test demo here)

Now I’m playing on a component that I’d like to use as replacement for the current “weekly review” game on Licorize. If you are wondering about a “game” on a GTD operation like “weekly review”, have a look at Game mechanics for thinking users article by Pietro Polsinelli.

The goal is to transmit the idea of having something to be “cleared”; a picture covered with black pieces should work fine!

The requirement is that the number of pieces covering the image must be pre-determined.

First of all I need an algorithm to “tassellate” the image with random shaped triangles. Actually the triangles are not overlaying, so I divide recursively the space available.

Go have a simple algorithm, first I split the image in two triangles, then I apply to both the recursive splitting.

A single splitting step:image

1) choose a random side

2) find a point (x) on that side, nearly in the middle

3) link the point (x) with the opposite corner and generate two triangles

4) apply splitting on both triangles

here is the code:

image

Then the recursive function: notice that I have to use a queue to “balance” the recursion on both splitted parts, otherwise I will divide only the first triangle reaching the exit condition (x pieces reaced).

image

Then I used my simple Stage object to manage canvas interactions (read lenscape a canvas interaction tutorial for details) as click on triangles, mouse over, etc…

I’ve also added a sound on “remove piece” button, but dealing with the <AUDIO> tag is another history…

Lenscape, a canvas interaction tutorial

Recently I started playing with the HTML5 <CANVAS> object sometimes having fun and sometimes feeling pain. I would like to share here my pains with your all 🙂

image

(see example and bookmarks)

I approached html drawing far in the past when svg was a weak light in the darkness of browser graphics. Mainly due to the lack of IE support for svg at the time I chose to create my own graphic library emulating  pixel drawing with thousands of lilliputian <div>.

In the following years I had only sparse contacts with html graphics but always having in mind the svg approach, where a line, a circle or whatever is a solid xml tag.

e.g: <ellipse cx=”300″ cy=”150″ rx=”200″ ry=”80″ style=”fill:rgb(200,100,50);”/>

this is really “natural” for me, html-writer: every single element has its own tag, and we are all happy!

Last month here, in Open Lab, we decided to start developing our first game (first for the company but not for the people working in it) and we decided to develop it using HTML5!

It’s time for me to resurrect dormant skills, and have a look at what is happening in the world of html gaming.

Surprise! Nobody is using svg for gaming, the main road is deeply tracked through <canvas> fields;  so then I started studying it.

First of all I got a punch in the stomach learning that a canvas is, as the word says, only a place where to “draw” something, not a place where to “store” something. That means that once you have put something in a canvas, there is no way to recall  it, or even worst to detect its presence.

This implies that if you want, for instance, to do something when clicking on a “circle” you cannot “bind” an event on that circle, simply because that “circle” doesn’t exist.  So if you need to interact with objects in the scene you need to work around it.

Actually this tutorial will explain how to approach canvas interaction,  so this will result as a shortcut for avoiding the pain and getting only the fun part!

Disclaimer: I know there are lots of html gaming engines as Aves recently acquired by Zinga, CAAT by HyperAndroid, Strikedisplay by Josh Strike or Impact by Dominic Szablewski (this list is far from complete). So if you are not interested in going in depth in canvas technicalities, this is a good point where to stop reading.

If you are interested in going deeper, first of all I suggest you to have a look at what is happening in the canvas world:  canvasdemos is a great source of inspiration. Then have a look to the canvas element reference, just to taste the complexity…

I chose as final destination of this short trip in the canvas world the construction of a simple application,that emulates a lens moving on a picture. In the meantime I’d like to lay the foundations of my own canvas animation(?) library.

imageSumming up I’m going to realize a lens, that will enlarge a part of an underlying background image.

The lens can be moved over the image, to get a detailed view, using drag&drop.

The first step is to have a large image, larger than the screen (e.g.: 4000 x 2000) with full resolution, and use it as canvas background.

In order to have a canvas background you can use at least two different approaches:

1) using CSS background-image. This is an interesting approach as the background is not in the canvas itself, so you do not need to redraw it once you clear the canvas. In my case this solution doesn’t fit as I need to stretch the image, and moreover this feature is not supported by all browsers, actually even canvas is not supported….

2) coping “bits” from an existing image to the canvas. I choose this approach even if this requires to redraw the background after each “clear” action, as this approach is supported by all browser canvas implementations.

First two rows of code: a general style for canvas and the “large” image

image

As the image is “large” everything starts at the “onload” event on the image, that may happen seconds after the page is loaded.

Just a couple of global variables to refer to the image, the stage, and the context.

image

img variable is used only for shortening code and is a jQuery proxy for the <img>. I used jQuery only because I’m used to use it, but it isn’t a requirement.

ctx is the canvas context and is the main entry point for canvas operation (have a look at the complete reference of 2d context); here context is reached via a global variable only for shortening code but the right place (“right” in terms of object modeling) should be in the “stage” object.

stage is the “object model” of our environment, this supplies the lack of state of canvas itself, it holds all the objects of our “world” in an array.

image

First setup fills variables and then initializes the stage:

image

We are creating a canvas with the same aspect ratio of the original image. The Canvas object is our model for html  canvas, it exposes two methods: init and draw.

Init method is responsible for canvas creation, context acquisition, and events binding:

image

Draw method is called every time you need to refresh the scene (really often during interactions) and, in our example, is here only to repaint the background:

image

so, just clear and use the drawImage function to perform a bulk copy from our “large” off-screen  image to the canvas. This is a sort of powerful bitBlit operation that supports crop, translate and resize operations.

Then the Lens object: it is responsible for holding the lens position and magnification. It exposes three methods: draw, moveTo, setMagnification.

The Lens constructor:

image

A little complication here is the fact that we are zooming over an image off-screen while we are moving over the canvas, so we need some scaling factor to calculate the position of the underlying point in the “large” image.

Then lens drawing.

The lens effect is rendered by copying a part of the “large” image, eventually magnified, by cropping the image in a round shape, and applying a radial gradient on an alpha channel.

image

Note once again the usage of drawImage method to copy and enlarge the image and the  clip method for creating a circular clipping region. Then we will apply the radial gradient using color with an alpha channel.

The lens modeled using a js object makes it comfortable to have one or more instances of the same object:

image

image

Here you see two lenses with different sizes and different magnification factors.

Now everything is working but there is no interaction with the user.

Lets try to add drag&drop capability.

I have to cite html5canvastutorials that helped me understand the first steps in managing interactions.

In order to start dragging we have to intercept the mouseDown event on the lens, but as I told you before, canvas do not retain the state of the object you’ve drawn on, so you cannot bind any event on the circle containing the lens: you can only bind events on the whole canvas, so if the user clicks the mouse on the lens you will receive the event on the canvas, not on the circle.

How to determine if there is your lens under the mouse? A simple, mathematical solution is to calculate the distance between the mouse and the lens center (you have all you need, mouse x-y coordinates from the js event, and the lens center from our Lens object), then if distance is  lower than the lens radius the click was inside, out otherwise. image

This approach will work fine mainly for rectangles and circles, but how to manage a complex shape like the one in the picture? (yes, I know that this sucks!)

In this case the “math” approach is definitively more complex.

Hopefully canvas can answer the question “is this point in path?”. The “sole” limitation is that you can ask this question “only while” your are drawing, that in terms of canvas context is only between context.beginPath() and context.closePath() calls; so we have to store somewhere the mouse coordinates, then ask isPointInPath(mouseX, mouseY) and store the result on the Lens object.

Summing up: all events are binded to the canvas object, the stage redrawing is called on mouse move, and the “over” state is recorded on the Lens object. Mousedown, mouseup, and mouseleave only perform simple operations.

image

Stage holds the object currently in drag status.

Note that we move the object that is first dragged on top of the stage.stageObjects list; this will act as a z-order operation, bringing the object to the front.

image

The running example is here, and source code here under MIT licence, so feel free to change and reuse.

All the material referred in this post is in my Licorize booklet for canvas related material: http://licorize.com/projects/rbicchierai/blogmaterial/canvas

I took the photos used as examples in my travels.

Ultra-light jQuery calendar

CalendarPicker: a new concept for date selection.

Read the component history.

Sometime I maintain my promises (rarely indeed 🙂 ), so I worked a little bit on CalendarPicker, receiving some suggestions from my previous post.

First of all thanks to everybody for precious feedbacks.

The hottest news in CalendarPicker is the usage  of mouse wheel to change dates; it is enabled on years, months and days bars.

I used the great mousewheel plugin by Brandon Aaron; just include the script for activate it.

Then I changed a little the CSS to enhance “today” with a yellow border.

image image

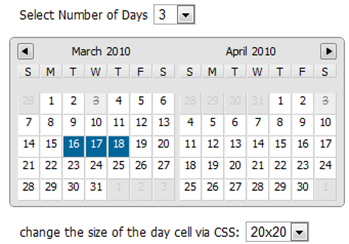
Another new feature is the ability of customizing the amount of  years/month/days displayed, so you can have bizarre configurations like these:

image image

Maxime Haineault argued that the next/prev buttons are no fashionable: now you can hide them!

Introducing the wheel movement I had to optimize calls, so callback function is invoked only when the user stops to play with the wheel.

I tried to maintain the code short (actually 180 rows), but the customization of years/months/days requires some computation for cell size; I first tried using only css properties in order to makes cells sharing space equally, but no luck. I need a css-expert’s hint!

You can see CalendarPicker at work here.

Feedback welcome!

So hard to have a date

An overview of 13+1  jQuery calendars, and a new ultra-light calendar picker.

When I was teenager (oh God, so many years ago!), my secret dream was to have a date with Elisa, curly hairs, blue eyes, tall, wonderful, curvy-classmate; actually this was the secret dream of every boy in my class. Unluckily  I looked younger, thinner, callow then others boys, so there was no chance of it coming true. So I decided to learn programming!

Today, I still need a date, well not the same kind of  “date”, a “date” in the sense of calendar ones, amazing how the years change your priorities!

Developing a new secret product (actually Licorize!) I needed to pick a date in order to roll-unroll the user log.

Using a third party component is a way to speed-up my development,  I narrowed my research to jQuery components; probably there are lots of calendar component for motools,  prototype, or stand alone ones, but jQuery is my choice, not going to change that!

I initially thought this was a simple quest: “of course there will be thousands of date pickers to choose…”

But nowadays is still hard to have a date, at least in a stylish way…

…  (if you want to see my component at work just go straight here ).

Here is the list of calendar components I’ve tried (before developing my own!).

Eyecon Date Picker

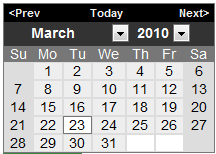
Firstly I came to Eyecon Date Picker. This is a really nice component. What I loved on this component is the flexibility for moving far in the past (or the future) with few clicks. imageimageimage

Clicking on the top row the component changes “scale” moving through years or months.

Date Picker  is released under MIT and GPL license, so it is usable also in commercial products (that actually is my case).

Date picker is fully skinnable, is quite light,  and really easy to use.

Basic usage is really straightforward:

$('#date').DatePicker({
	flat: true,
	date: '2008-07-31',
	current: '2008-07-31',
	calendars: 1,
	starts: 1
});

Another interesting feature is that it supports period selection:

image

and a cell renderer that can be used to highlight holidays, disable some days or whatever your application needs.

I was so happy to have found this component that I included it immediately on Licorize, before discovering a little spot that made me discard it: when you change scale by clicking on a month or on a year it closes the popup (when in popup mode). It is completely acceptable in mostly cases, but unluckily not in mine.

jQuery UI Datepicker

Then I tried the “standard” jQuery UI Datepicker, that is a really rock solid component. imageSupports keyboard navigation, internationalization, lots of options, events, and methods. It is skinnable with ui theme roller.

It is hard to find a component so well engineered.

It relies on an input field, this means it is intended mainly for  data insertion. It can be used as stand-alone calendar too.

Probably playing with the options you can steer Datepicker where you need.

The minimal usage is really “minimal”:

$("#datepicker").datepicker();
...
<input type="text" id="datepicker">

On the other hand,  mastering this component is not a joke with dozen of parameters. Even the weight is considerable (if you are interested in this single component only). This happens for every jQuery.ui component, either you accept it and embrace the whole platform or you extract a single part – it may be hard. This is why I didn’t adopt it.

Date Range Picker

An interesting extension of jQuery.ui date picker is Date Range Picker by Filament Group.

This manifests the quality of ui components. Seeing this component at work is quite impressive:

image

It supports preset ranges in menu (e.g.: “Office closed”), range clicking and other catching features. In one world power, but definitively not lightness!

jQuery Datepicker

Keith Wood  released jQuery Datepicker under both GPL and MIT license.

Great the demo/documentation site!

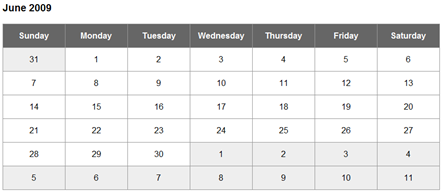
imageimagejQueri.ui datepicker is based on this component: the ui one has only less features… this should give you an idea about the power of this plugin.

Every kind of feature is supported, multi-languages, cell renderer, range selection, inline, years/months fast switching, cell disabling, date formats, multi events and much more.

The usage is simple, as simple as your requirements are.

Keith developed also the Date Entry plugin image a single input field with a pad for changing date fields.

jQuery date picker

Kelvin Luck gives us a strong jQuery date picker. It is unobtrusive and really well documented, lots of use cases are ready to be used.

image

It can be used both inline or as input field, in single or multiple views for period selection.

The basic usage is the standard one:

$('.date-pick').datePicker();

It supports internationalization and cell rendering.

Probably the look-and-feel is not at the top.

jCalendar

imageI have to cite the jCalendar by Ted Serbinsky:

This is an outdated component and how the author says “this project has been  superceded by the most excellent jQuery UI

So why didn’t I  believe in Ted and do the same thing? We’ll see that after all the reviews.

jQuery date-picker

image

Now is the turn of  Ted Devito with jQuery date-picker:

This is a quite rough (and even uncompleted) component, at least compared with previous jquery ones, but at least it has the gift of simplicity.

Usage is in jQuery style:

$(‘input’).simpleDatepicker();

jQuery Calendar Widget

Then I found jQuery Calendar Widget Plugin by Ei Sabai Nyo that is by far the most compact calendar I ever found: 99 lines of (unpacked 🙂 ) code!

image

Ok, probably it is not so powerful, but can be easily integrated and used in your applications; yours, not in mine!

Dyndatetime

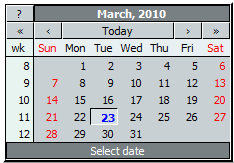
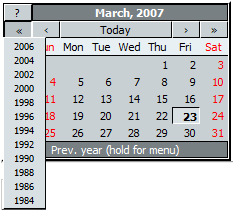
Dyndatetime is an iron-looking date selector. Releases under GNU by thetoolman, it has a cold appearance, but is filled of interesting features. First of all it allows fast year switching by holding the fast back /forward buttons.

imageimage

Documentation is at least weak, well ok absent, but there is a test page with a couple of examples. It supports multiple languages, date formats, time formats (!)  and some small custom features. Easy to use and effective.

jCal

imageAnother nice example is jCal by Jim Palmer.

This is a multiday calendar date picker. The focus here is on date range selection, but this seems a nice piece of code.

It is released under MIT license.

jQuery Date Input

imageLast but not least is the jQuery Date Input by Jon Leighton, “no frills”, as the author says. “No frills” but a really mature component. Release under MIT license supports all main features like first day of week,  date formatting, css.

Stable and cool, is really pleasant to use.

But it is still not on my way.

… and now?

At this point you are probably asking what I’m looking for: well have you seen on these components a shine of innovation?

I want something more, more original, prettier, cool… not another grid, please!

Someone can argue there is no reason to innovate on calendars. A calendar is a calendar, full stop!

Well I’m usually reluctant to change user habits, but sometime I need fresh new air. Licorize, ops, my secret product, is full of new user interface techniques, so why not innovate moving in time?

The inspiration come to me looking at jQuery timepickr by Maxime Haineault:

image

This is a new way to select hours. It’s usage is practical and immediate. The author was brave in choosing to accept the practical limitation of 15 minutes steps, that could receive lots of user complaints, but this always happens when innovating.

And now, I’m proud to announce my new free-light-weight-jquery-date-picker…

(read about the new version here)

image

At last I decided to develop my own component. I called it CalendarPicker (try a demo here). Calendar picker is released it under MIT license.

Eureka! It looks different from all the others, supports multiple languages, and allows fast movement across months and years.

I know that this approach is not suitable for every context, but I hope someone else will find it useful.

The basic usage looks like:

$("#calendarFilterBox").calendarPicker();

Of course you will probably need to do something with the selected date 😉

In this case the callback function will help you:

var dateSelector;
$(function(){
  dateSelector=$("#calendarFilterBox").calendarPicker({callback:function(cal){
    alert(cal.currentDate);
  }});
});

A function will allow to change the current date. For instance to set date to today:

dateSelector.changeDate(new Date());

A more comprehensive example with names customization looks like this:

$(function(){
  dateSelector=$("#calendarFilterBox").calendarPicker({
    monthNames:["Jan", "Feb", "Mar", "Apr", "May", "Jun", "Jul", "…more…],
    dayNames: ["Sun", "Mon", "Tue", "Wed", "Thu", "Fri", "Sat"],
    callback:function(cal){
       $("#mydate").html(cal.currentDate+"");
  }});
});

Your feedback will be deeply appreciated, as always.

An html sanitizer for C#

sanitizer After 3 months gestation and some bug fixes, HtmlSanitizer is reporting no hacking successes.

Does it mean that it rocks? I don’t think so, but it is probably strong enough to sail in stormy waters.

See my previous post to know how it works, but mainly test it online with the Patapage playground.

Being honest I received some complaints concerning the black list approach to CSS styles, but no one has hacked the current version (yet 🙂 ). In any case the code is open to changes, and I’m happy to receive your feedbacks.

Now we are proud to announce that there is a porting to C# by Beyers Cronje (thank you). You can find C# sources here (and Java ones here).  Warning: source code is already patched as suggested by Isaiah.

Other portings are welcome!

A delicious javascript tagging input field

A brief review of existing components and the presentation of the powerful “jquery.tagInput”

Once again, working on one of our new secret products (which is called Licorize 🙂 ), I was in need to select a third party component for speeding up development:  this time, a tagging field.

… before continue reading do you like to go straight to live demo?

I realized in seconds that I already had in mind a delicious solution. Delicious (.com) and its wonderful tagging system its really nearly what I wanted, probably even a little more…

What I really love in this component as seen on Delicious is the smoothness of user interaction. Let me explain the concept: try to write a tag directly from the input field and the drop down will show your already used tags, in order of frequency. Amazing, mainly it saves me scrolling the list: most used on top, golden rule. This is not different from what usually the other components do, but in this case the string searched is a little bit “boldified”. This is stylish!

image

Another nice feature of delicious’s tagging field is the integration with “recommended” and “popular”: not only by clicking the tag it is inserted/removed like every nerd-programmer will be able to imagine, but even while you are typing in the input field, the suggested tag is magically highlighted – this is a masterpiece!

Of course the interface behavior is supported by meaningful contents: suggested tags are computed on the base of the analysis of the url contents and mainly, I suppose,  on other users tagging criteria; having million of users makes the term “statistic” meaningful.

(BTW you can access this data using the Delicious api)

The only things I would change in this jewel is the tag separator from [space] to [comma]; this will give you the capability to add multiple word tags, even if it may induce the user in using the tag field as a sort of notes one. So the separator “flavor” may open a Pandora’s box: if ever in my life I’ll write a tag component – which I’ll try to avoid as much as possible.

Apart from the separator, I needed exactly this component, but unluckily it is entangled in Delicious’ js library, so I decided to have a look at available jQuery based components.

As usual this list does not pretend to be complete as I’m focused on developing products, not on writing reviews, but someone else could find my hints useful (I have already wrote some reviews on charting and grid components).

The top ranked one  is jQuery tag suggestion by Remy Sharp.

image

This nice component is very easy to use and is based on an array of suggested tags that can be supplied via a js array or via Ajax.

A basic axample:

$('input.tagSuggest').tagSuggest({  tags: ['javascript', 'js2', 'js', 'jquery']});

An Ajax example

$('#tags').tagSuggest({  url: '/tag-suggestion'});

Layout is configurable via css, and some parameters will help you in fine tuning this component.

Even if this is a nice component it is quite far from Delicious one, at least because it does not implement multiple tag collection: mine, suggested, popular. Another little limitation is that the suggested tag list is static, even if called through Ajax.

Another cool component is Tagger by Chris Iufer.

image

Here the focus is on maintaining  a tag list, instead of filling a field.

Usage is really simple:

<input class=”tagger” type=”text” name=”tags[]” />

<script type=”text/javascript”>

$(document).ready(function(){

// add to tagger element by index

$(‘.tagger’).eq(0).addTag(‘photo, design, creative’);

// add to a specific tagger element by Id

$(‘#places’).addTag(‘mountain view’);

$(‘#places’).addTag(‘chico’);

});

</script>

But this is even farther from my goal…

Even Pines Tags by Hunter Perrin goes in the wrong direction, at least compared with Delicious. It is focused mainly on writing / removing tags (like the previous one):

image

The documentation is little bit weak but usage is still easy:

$(“#tags”).ptags();

In the same flow is JTAG by Benoît Vidis

image

cute, but not my prefered one.

Another component that cought my attention was MagicTags by Dave Geddes.

image

Nice graphics, but here the core seems the transitions effects, making the usage of this component at bit annoying.

Nice look, but similar behavior for  TestBoxList by Guillermo Rauch.

image

That’s all folks!  I didn’t find other components, maybe the “tag” search key induces too much noise in search engines, but differently from usual there aren’t dozens of components, the choice is limited.

So I reached this sad conclusion:

I MUST WRITE MY OWN COMPONENT!

At least now my requirements are clear:

  1. supporting already used tag list, eventually filled with an Ajax call
  2. filtering results using user inputs
  3. supporting suggested tags, with “smart” selection
  4. supporting multiple separators
  5. supporting frequency
  6. having a nice-ligth-stylish look
  7. be delicious!

After a couple of days of programming this is the result:

image

typing on the text field a drop down will show your used tags:

image

I’ve set up a live demo on BugVoice site (new secret product is offline for the moment).

The usage is quite easy at least in the minimal configuration:

<link rel=stylesheet href="jquery.tagInput.css" type="text/css">
<script type="text/javascript" src="jquery.tagInput.js"></script>

insert your input field:

tags: <input type="text" size="80" id="tag" >

then instantiate the component:

<script type="text/javascript">
var myTags=[
  {tag:"js",freq:30},{tag:"jquery",freq:25},
  {tag:"pojo",freq:10},{tag:"agile",freq:4},
  {tag:"blog",freq:3},{tag:"canvas",freq:8},
  {tag:"dialog",freq:3},{tag:"excel",freq:4} ]   $("#tag").tagInput({ tags:myTags})
</script>

This is just a static case example; in case you have thousands of tags, you should use something like a Json Ajax call.

There are some configuration parameters, this is the complete list:

  1. tags: is a Json array of objects with “tag” and “freq” properties; freq is not mandatory if you do not use it for sorting. It is not mandatory if jsonUrl is specified.
  2. jsonUrl: will receive the text of current tag typed in the “search” parameter.
  3. autoFilter:  true/false  default=true when active shows only matching tags, “false” should be used for server-side filtering
  4. autoStart: true/false default=false when active the dropdown will appear straight on entering the field, otherwise only while typing
  5. sortBy: “frequency”|”tag”|”none”  default=”tag”. When sorting by frequency is on, the filler should report the “freq” property for each tag
  6. tagSeparator: default=”,” any separator char as space, comma, semicolon
  7. boldify: true/false default true “boldify” the matching part of tag in the dropdown box
  8. suggestedTags: callback function to retrieve an object array like [“sugestedtag1″,”sugestedtag2″,”suggestedtag3”].If this parameter is not present tag suggestion functionality will be kept hidden.
  9. suggestedTagsPlaceHolder: jQuery proxy for suggested tag placeholder. If it is not supplied it is created below the input field. When placeholder is supplied (hence unique), tagField should be applied on a single input.Something like  $(“#myTagFiled”).tagField(…) will work fine: $(“:text”).tagField(…) probably not!

so a more complex example will look like:

<link rel=stylesheet href="jquery.tagInput.css" type="text/css">
<script type="text/javascript" src="jquery.tagInput.js"></script> 

tags: <input type="text" size="80" id="tag" >
suggested tags: <span id="suggested" class="tagInputSuggestedTagList"></span> 

<script type="text/javascript">
  $(function(){
    $("#tag").tagInput({
      jsonUrl:"tags.jsp",
      sortBy:"frequency",
      suggestedTags:  ["jquery","tagging","tag","component"],
      tagSeparator:" ",
      autoFilter:false,
      autoStart:false,
      boldify:true,
      suggestedTagsPlaceHolder:$("#suggested")
    })
})
</script>

in this case the jsonUrl “tags.jsp” is a silly JSP page that will return 4 tags starting with the text typed by the user. Here the sample code:

<%@ page import="net.sf.json.JSONArray, net.sf.json.JSONObject" %><%
  JSONArray jsa= new JSONArray();
  String search=request.getParameter("search")
  search=null?"":search;
  for (int i=1;i<5;i++){
    JSONObject o= new JSONObject();
    o.element("tag",search+i);
    o.element("freq",i);
    jsa.add(o);
  }
  out.print(jsa.toString());
%>

This component is released under MIT license. Enjoy it!

Any feedback will be really appreciated.

JavaScript grid editor: I want to be Excel

A short list of my favorite JavaScript grid components.

How many times did you hear users asking you: “something simple, a grid like excel”?

When I was a VB programmer, oh yes, I have this dark spot on my career, and it is not the only one… this request threw me in panic. Usually what your “killer” is asking you is not what you, programmer, are thinking of (namely the power of cell functions, programmability, graph etc., that probably your “killer” does not even imagine): what they are thinking about is the editor flexibility, the ability to add columns, rows, move cells blocks, copy and paste from different sources.

After the ritual pointing-out that your application is NOT Excel, the VB solution was to adopt the standard flexGrid or the mythical TrueDbGrid that made happy both the killer-user and the victim-programmer.

But my VB era is long gone and nowadays I’m fighting with JavaScript and Java web applications; how to address the same old request of “something like Excel”?

I spent some days looking around for a solution. I warn you that this post does not pretend to be a complete list of available grid/table editors and that my investigation is mainly  “emotional”: I want to feel on a web-app the same prickle that I experience when using Excel.

Of course it is not only romantic surfing, I needed to edit data to fill the graph snipplet for Patapage, so there are some “nice to have” requirements: to be free of charge, light, based on jQuery, appealing. Server side aspects as pagination, sorting, CRUD etc. are for the moment not the crucial points as the amount of information I need to manage is limited and a totally client side solution would be acceptable.

Actually the implementations I found can be classified in three main groups:

  1. data driven: these are generally components with all the features needed for listing a large number for rows, with server-side pagination, scrolling, search and sort functionality; generally are lacking editing functionality, or when the feature is present is single row based, reflecting the fact that there is an underlying database. Data binding is made through XML or Json, depending the language supported server-side
  2. light edit: here the focus is given to the “editing agility”, every row is always in editing status,  search and sort are rarely available and in any case working on a limited set of rows isn’t a real limitation. Data is filled starting from a JS object, calling methods, or from an html table.  Some of these implementation supply callback methods that can be used to interact server side.
  3. spreadsheets: oh yes! there are also some really sophisticated JS clones of the glorious one! These are generally  complex solution (in terms of dependencies), supporting formulas, graphs and lot of functionalities. Here the focus is the “simulation effect”, data management and server side integration are really in background.

When I started my search I didn’t imagine that there were so many solutions, so I decided that it would be better here to limit the result to the ones based on jQuery. Lets go in depth :

Data Driven

One great example of this category is jqGrid by Tony Tomov. This is a really well engineered solution released under MIT and GPL licenses.

imageSupports pagination, search, sort and even edit. There are two specific versions for PHP and .NET that drastically reduce the server-side implementation effort. Loading data is supported in multiple ways through XML, JSON or JS arrays and examples are supplied for PHP and MySql. There is a third party Ruby example here.

It uses jQuery.UI components for display, so the look and feel is pretty.  Switching to edit mode is something perceivable, the user will see that the edit is active, but this is not necessarily bad in this class of components.

It supports sub-grids, multiple input types, master-detail, multi-selections and other useful features.
Column configuration is done in a declarative way using JS objects:

colNames:['Inv No','Date', 'Client', 'Amount'],
colModel:[ {
  name:'id',
  index:'id',
  width:55,
  editable:false,
  editoptions:{readonly:true,size:10}
},…

that gives you the flexibility you need for well tailored applications.

Seems a rock solid components, the behavior in resizing, scrolling, paging is really pleasant.

Documentation is not the strongest point but there are lots of examples that will help setting up your grid.

by Allan Jardine released under GPL v2 and BSD is a powerful data grid component.

image

Supports pagination, resizing, filtering, multi-column sorting, jQuery UI theme roller, and lots of interesting features.

Data feeding is provided a-la-carte, from DOM, Ajax XML or JSON sources, JS arrays… it’s your choice!

There is also the icing on the cake: cells and rows grouping, cell custom renderer, multi-row selection and much more.

Provides cell editing via jEditable cell-by-cell, not a row at once, and this in some cases could be a limitation; so you may need more that one update to change a row. Probably you can work around this trivia-point.

Configurations starts from zero-config in case of DOM feeding and can be refined to a real full-control using JS objects.

It is well-documented with a large set of examples and this is another plus!

A black spot (at least for me, Java programmer): server side examples in PHP only.

Another valid example is Flexgrid by

What I really appreciated in this component is the lightness and its simplest feeding example based on an html table. In this case  the whole setup consists of:

$(“#mytable”).flexigrid();

image

Of course this is a quite minimalist approach to this component that supports also XML and JSON data feeding.

Paging, sorting, resizing and other nice features like button injection are supported.

What is missing is the edit capability that is planned but still not released.

Similarly to the previous component the configuration (if needed 😉 ) is done by JS objects.

Documentation: we all are programmers, we hate to write it but we love to read it… so here too is really succinct with few examples for PHP server-side both XML and JSON.

tgrid by Mateusz Mikołajczyk is a lightweight datagrid, that supports all main features like sorting, paging, filtering.

image

I didn’t discover the license type so be careful on usage.

Data is fed by Ajax Json calls that make this component scalable enough.

Documentation supplied is “short” but with some examples, so setup is not a big deal.

This components supports a “row rough” edit, in the sense that it is not in-place, but out of the grid: it did not give me the right feeling. Taken out the edit, tgrid runs well.

Configuration does not offer many options; something nice is the cell custom renderer that allows you to format data.

Ingrid (great name!) is a less powerful grid component, but it is really unobtrusive and cute enough to be considered. Released under GPL license, it supports column resizing, sorting, paging etc.

image

Data is fed only by providing an html table, and this could find some criticism.

Google Chrome support has some little creeps on display.

Multiple row selection is a nice feature that earns some points to this component.

Editing is not supported.

In the same spirit of loveliness jTps by Jim Palmer is released under MIT license.

image

Paging, resizing, sorting are supported; a nice feature is smooth scrolling. Even in this case editing is not supported, but the real limit of this component is in term of scalability: data feeding does not support Ajax sub-sequential loading, so all data is loaded at once. Paging is only client side limiting the meaning of this feature.

Same category for dhtmlxGrid by DHTMLX.

imagedhtmlxGrid is a JavaScript grid component with editing capabilities, and server-side data binding. It is a powerful component with so much advanced features (such as filtering, searching, grouping, charts integration, math formulas, etc.) that it could be included in “Spreadsheet” group too 🙂

dhtmlxGrid is distributed under GNU GPL v2, but also available under a commercial license.

It is built over a “dhtmlxcommon” js library instead of most famous jQuery or Prototye libraries, but this is not a big deal if you need such powerful component.

For the sake of completeness I have to cite TableEditor by Brice Burgess that seems a little bit outdated (even if really well indexed), and Snowcore’ jQuery Data Grid that is in Russian and this fact did not help me to understand how to use it; moreover the site icon noie let’s me suppose that IE testing is not a priority for Snowcore 🙂

Light Edit

This category, as before stated,  is mainly focused on edit agility instead of server-side data management. This fact steers the implementation towards a all-client-side approach. Implementations in this category are generally a little bit rough with respect to the previous ones.

imageA  real interesting exception is the excellent SlickGrid by Michael Leibman released under MIT style license.

Here the author is particularly careful in rendering performance; he uses a virtual rendering technique to limit the number of DOM elements in order to make SlickGrid really scalable. The example provided with 50000 rows really run in a flash.

The author states in the “grid vs data” paragraph that here the focus is on the grid, not on the data. Despite his intentions, sorting, resizing, filtering, resizing and edit callbacks, give this grid a place even in in the previous category.

Data feed can be done via JS arrays, or via Ajax using the Slick.Data.RemoteModel object provided.

imageCustom cell renderer allows you to express your creativity, as shown explicitly in the examples when injecting a Sparkline graph in the last column (see my previous post for a excursus on charting components).

Rows multi-selection, ordering, and custom row rendering using John Resig’s micro-templates makes this component really flexible.

Configuration is done as usual using JS objects.

Having all this features and also having taken care of cell movements with the keyboard and easy editing is a great achievement!  Thanks Michael.

Once again Allan Jardine provides us a useful tool called keytable that injects Excel-like key movement on a generic table.

imageThis can have multiple usages as exemplified on demos available on the site. It easy to understand how a key-movement can change the user experience when it is used on a powerful grid component like DataTables (see above). Here the author’ example.

Another really basic example of editable table is supplied by Greg Weber with uiTableEdit: there are no examples online, so I built a simple test page, and the components just add the capability to change the cell value. No key movement or other additional features are handled; it can be used as starting point for further refinement.

imageSame kind of “roughness” for tEditable by Josh Hundley, where edit is click based, and key-movement is not supported. This do not mean that this tools is useless, just that it is really far from a complete solution.

It converts DOM cells to text-areas on the fly when editing, and this makes this component almost setup-free.

A part of this category (the rough part 🙂 ) is my contribution, used to fill data on PataPage’ charting playground.

image image

Here the functionality are really basic: key-movement, edit, load from url, add and remove only are supported. The grid content is “saved” on a text area with \t and \n separators: same format expected when loading from url. I’m working for supporting  the ^v (paste) capability to facilitate user data insertion as block of cells.

Spreadsheet

Actually this category comprises solution wider than previous ones, in the sense that a complete solution will probably include all the features listed before; this is on one side a plus, but on the other side if you are interested in extracting some parts (e.g. table edit but not on formulas, server-side integration but not on key-movement etc.), this could be a little difficult due to the complexity of the solutions available.

Light years beyond other solutions at least as first impression, jQuery.sheet by Robert Plummer is a really wonderful library. I didn’t find the license type.

image

Really looks like an Excel sheet and the key-movement seems realistic.

Data feeding is done using a DOM table, eventually Ajax-loaded, or by adding row and cols programmatically.

The grid supports resizing, but the real wondering feature is the cell-function support. Not limited to SUM, AVG and other standard functions, but also chart are allowed.

Lots of callback will help you to integrate the sheet on you application.

There are some little bugs on cell selection and some minor layout issue with Chrome, but the overall behavior is impressive.

The last, but definitively not least, example of websheet (a web spreadsheet) is the Googledocs one. It is a really good live-teaching example, and even if it is not a ready-to-use library I suggest you to open it and dissect it with, for instance, Firebug.

It is interesting to see how many tricks they used: the whole grid is one iframe, the rows are grouped in small tables of 20 rows (probably in order to scale on IE), the cell value is stored in the td dom; when you edit a cell a text area is printed over the cell (not inside), and so on.

I tried to implement my grid using the same structure, but after some hours I surrendered; the effort to “master” the layout was over my actual estimation, and I fell back to the solution discussed above.  Would be gorgeous to have a jQuery open-source implementation like this!

Google docs spreadsheet is the only application I found that gave me  the right prickle!

Well I stopped my searching here, and I didn’t explore Mootools, Sriptacolous, Ext and maverick ones in detail.

There is a booklet for this blog post here on licorize.com. (Licorize is one of my latest creations, please take a look)

I’ll just list here some other libraries I found:

Spreadsheet Dojo Widget image

image

Ext JS DataGrid

YUI 2 DataTableimage

Simple Spreadsheetimage

BlueShoes SpSpeadsheet editor image

TrimSpreadsheet image

Sigma Grid 2.2image

30 years riding IT: part3

1983

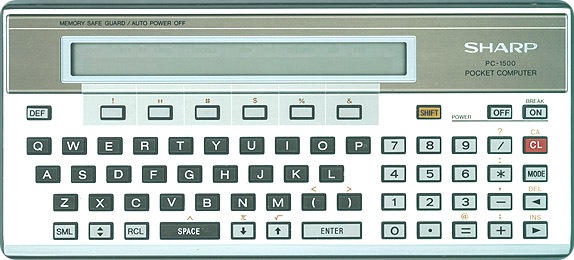
Technology was running fast in that era, and just when I started studying Synthetic Programming (a way to use some more non documented function in your rpn code for HP41cv), (see previous blog) Massimo bought, in a Suisse shop, a terrific new programmable calculator the Sharp PC-1500, shouting me in panic.

pc1500

Sharp PC-1500 was, in my mind, the best technology the humanity could do in that years.

PC-1500 have a real-shaped keyboard, 4Kb RAM, a dot addressable display (7×156 dot LCD), a plotter (not included) and a “standard” programming language that do not force me to think like a polish men 🙂 and “she” talks BASIC!
After two shop painted, three days as HiFi expert for Saba stand in a local electronic event, and selling of my “old” HP 41cv, I got enough money to take a train, go to Suisse and buy my “new” PC-1500.

DIA_00761In the meanwhile, my studies going slowly. Chemistry, Geometry, Physics, Design was interesting, but I spent a lot of days on my PC-1500, looking a way to make enough money to have the freedom to do what I really love: travel around the world taking pictures.

But my parents was more realistic than me and: “no exams? no money!”, so I enter a loop where I play with PC-1500 -> no time to study -> no exams passed -> no money from parents -> find a work to get money -> spend money in traveling -> study just a little -> pass an exam -> write a lot of code -> do money …. and so on.

This style-of-life hang me on Engineering faculty for about 14 years :-).

Back to PC1500:

Sharp PC1500 was a very well done product (was the “porting” of the Tandy/Radio Shack TRS-80 PC-2.), so was tested and robust.

PC-1500 with its printer/plotter was able to record the programs on audio cassettes. In this way we could save our production.

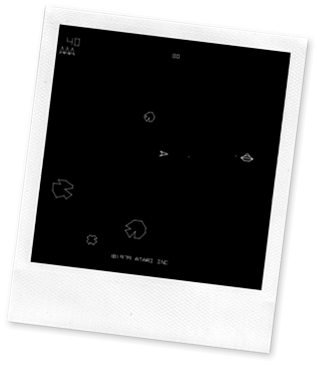
Asteroids But the life it is not only work! Massimo and me were used to spend spare time playing the latest video game: asteroids! There we started, probably, the first experiment with “pair programming”: one to the joystick, the other one to the buttons. Sometime we get the hi-score and as there was only 3 char to write the name we create our brand: R&M.

With this brand we signed about 150 projects and product.

Back to PC1500 again:

The strongest exam on the first year for an Engineer was Mathematics I. Function studies, integral, series, and son on. Sometime have an idea on what you have to study for you exam could be helpful. So we start a production of mathematical software able to:

  1. Plot your function on PC-1500 plotter (plotting during the exam is a little bit noisy, but you can use your coat, even in July with 30°, to cover the plotter), its first and second derived.
  2. Know a-priori if a series on integral converge or diverge.
  3. Know a-priori if your function can have zeros

With this tools, the written part of Mathematics I examination was like a joke.

Writing this software I learned a lot about basic, number, precision etc. So we were ready to start something more professional.

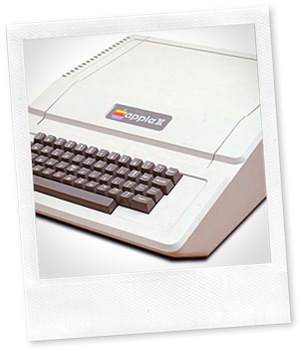
The “Medicina II” an University’s Clinic was looking for someone able to translate an old statistical program to its newest Apple IIe.

appleii-right

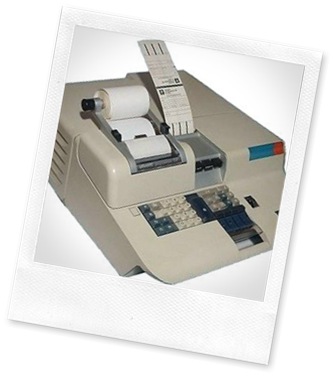
Software that we are called to translate was written “on paper” using a graphical notation and typed (or recalled) on a strange Olivetti Programma 101 “computer”

olivetti_programma101

The work was amazing but we learnt for the first time that the BASIC is not exactly the same BASIC everywhere; and the calculus too, can be slightly different.

LESSON 1: STANDARDS ARE STANDARDS, REAL WORLD NOT!

But that was the very first “paid-software” we did.

Obviously at that time the code was to keep “secret” and we used several tricks to protect our production (control char like ^L in the source code, remove commands etc.).

The hungry of knowledge brought us explore wider territory.

I bought in Paris a funny book “Graphism Scientific pour l’ordinateur personnel” and we started new graphic experiment on pc1500’s plotter that was really not enough.

image We discover in a dark side of S.Marta (S. Marta is were Engineering Faculty is located in Florence. It is was a big old monastery with a kind of dungeon underground) a terminal connected to a PDP server. It was definitively forbidden for newbies like us, but after some days of circuiting the administrator we get a limited  access to read the on-line manual. But the manual was for “standard” user and we need something more, so we get a copy of administrator manual and we started to experimenting new powerful command. Unluckily something went wrong and we launched a process that write something in the “on-paper console” without a way to stop it 🙁 . All this happened in the late evening with nobody near the printer and the printer well locked behind a strong door.

The day after, 1 kilometer of paper was finished and our first PDP experience too.

Working on PC-1500 was really less dangerous!

The AI (artificial intelligence) is (or was…)  an amazing science and we read something about experts systems, and that Lisp was the best language to implement it.

The mythical Texas Instruments’ Lisp machine was light year far for our dreams, and we have to arrange something less expensive.

We get some BASIC code for a Lisp interpreter written by I-don’t-remember-which University and we decide to “port” it to PC-1500. The article was full of theoretical induction about Lisp language, and the porting went quite smoothly.

The performances was not excellent, minutes to evaluate “(+ 1 2 3 4)”,  but the experiment was interesting at least because give use the chance to realize something based on strong theory and to learn something about Lisp. Our attempt to create an expert system sunk on the performance beach.

Not completely happy with Lisp interpreter experience we decide to develop a BASIC “expert system” trained in mushroom identification.

In our expert system experience we discover, for the first time that, sometime, a simple and direct solution could be more and more effective than a solution “based on strong theoretical fundaments”.

Our expert system was used and trained with fun for years by a mycological group in Florence: the Lisp one, died before to bloom.

LESSON 2: SOMETHING RUNNING MAKES USER HAPPIER THAN A THEORY

After AI we go back studying “graphism scientific”; reading French computer’s book is really sharpentiers_08funny experience. I suggest to taste “la mémoire vive de votre ordinateur”.

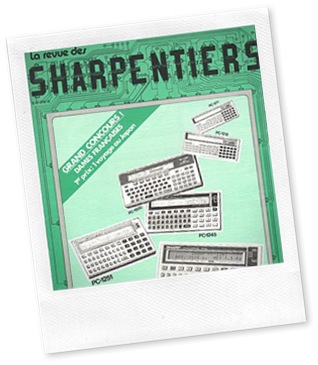
Another source of inspiration was the french magazine “Sharpentiers” (that sound like “carpenter” that reflects quite well the “hand made” style of that years) dedicated to Sharp users.

In some week we develop a “3D wireframe CAD” for PC-1500 (do you know that for rotate a 3D object the algorithms uses the matrix? We do not! But we learned it some years late in our study, when the problem was completely solved: sometime studies are useful!).

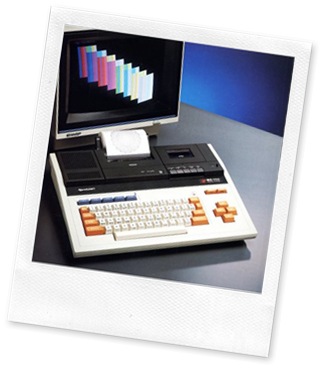
The CAD was funny and even if data insertion for complex drawing was a nightmare, an Architect’s studio want to use it. So we “port” our Cad to the very best of Sharp: MZ-700.

mz-700-1a They pay a lot of money, for that time our standard: 170.000 ITL (about 85€ )

image

image

But the luck smiles to the brave, and in a Florence book store I found a strange blue book: the “PC 1500 Technical Reference Manual” was at that time in Italy one of the most wanted book for PC-1500 owner.

This manual opens the hardware and software architecture to our hands.

Sharing that information with our friend (share doesn’t necessary means “for free”, so this manual became a great business) we meet a large group of PC-1500 users.

There we discovered that one of pins in the PC-1500 connector, was suitable for one-to-one (probably now “pear-to-pear” sounds better) communication. First of all we need a 60pin half pass connector, but it was not available in almost all electronics’ shop in Italy.

Florence is the artisan’s mainland, and with the patience of our ancestors I build my 60pinhalfpass connector. Was really disgusting to see, but was working.

In the meanwhile the German PC-1500’s user group will develop the Macro assembler compiler and a Forth interpreter. We bought both.

With Technical manual, macro assembler, and cable we are ready to start the first 1-to-1 communication software. Obviously the only way we can use to communicate is to open/close a single port. It is not so easy to use one port for bidirectional communication, and we invented our protocol. The unexpected, sometime mystical, behavior force us to learn about timing, clock cycle, slopes, micro-instruction length, and all thing that make me happy to develop now in java without knowing anything about hardware and operating system too.

But in the end the communication software was very well running, and very useful to communicate with Massimo during one of infinite Engineering exams.


http://www.pc1500.com/

JavaScript charting tools: an overview

Tons of charting tools, one better than the other, how to find yours?

I was working on adding a new widget for Patapage. Sometime you need to publish a simple graphical report on your page, a chart, based on a small set of data that you may want to change quickly online.

As requirements, I wanted to have an immediate feedback of data and configuration changes so I chose a JavaScript charting tool instead of server-side generating “chart images”.

Few years ago this approach was almost impossible due to the lack of cross-browser plotting libraries. Nowadays  there are many powerful plotting tools: this article will introduce some of them and will explain how I got to choose my plotting library.

First of all I had to restrict the selection to those that are licensed for usage in a commercial products, but this is not a big deal; most of them are under LGPL, or MIT license.

imageMy second requirement was the compatibility of the JavaScript library: we use jQuery so I had to drop the great plotr library that is based on prototype.

Actually Solutoire has also a Prototype porting of flot called Flotr.

imageSame technology for Protochart. For the same reason I quit in tears the amazing jsxgraph. What I loved of this library is the universe of interactive examples provided by the community. If you do not have library restrictions have a in-depth look to this jewel (if it doesn’t fit, give yourself at least a recreation playing for few minutes with the examples 🙂 ).

imageAlso Raphael is a real impressive product, but even in this case it doesn’t relay on a “standard” JavaScript library, and mainly it is a low level vector library, in the sense that it doesn’t supply any specific chart plotting functions. If I had to write a graph library from scratch I’ll probably start from here.

imageMooTools user will have on their side moochart or canvas pie.

image

For jQuery fanatics, like me, there are lots of bullets too.

image

First I started having a look at the flot library. I was astonished to see how well engineered this library is . IMHO one of key point is that the whole configuration is defined by using a JavaScript object, so a basic example that will produce the cart on right side will look like:

<script>$(function () {    var d1 = [];
    for (var i = 0; i < 14; i += 0.5)
        d1.push([i, Math.sin(i)]);
    var d2 = [[0, 3], [4, 8], [8, 5], [9, 13]];
    // a null signifies separate line segments
    var d3 = [[0, 12], [7, 12], null, [7, 2.5], [12, 2.5]];

    $.plot($("#placeholder"), [ d1, d2, d3 ]);
});
</script>

This approach is very practical when you work with json objects, especially for data series. Another nice aspect of this library is that series configuration and data are on the same object. Of course when you need to use advanced charting features (time series, label formats. ticks etc.) the configuration will become quickly complex and not really readable, but on the other hand the basic approach is straight and painless. Unluckily flot at this moment does not implements pie renderers (to be honest there are some  implementation from the community – see flot issues), and this was one of my widget requirements. Another little spot is the documentation that is complete but really ‘60 stylish. Even the examples are a bit poor but enough for starting quickly.

image Then i moved to Sparklines that is a very easy-to-use and intriguing library; I like their site with lots of small charts.  If you need to create dashboards for your site have a look at this plugin. Even in this case configuration and data uses a JavaScript object.

Sparklines was a little basic for my needs so I tested TufteGraph and   jQuery Chart; I found both lacking in features.

Then I landed in the jQuery Visualize Plugin from Filament group; they have a really smart idea; leave the data on a HTML table!

So the data will look like

image

imagethen the configuration is done as usual by passing  a JavaScript configuration object to the drawer function. On their site there is a nice sandbox to try configuring your chart.

If you already have table displaying data just add a line of code to have your chart.

Of course this is a completely different approach from flot, where to have the same visual effect you must write tons of lines; on the other hand jQuery Visualize does not give you complete configurability, but only reasonable ones 🙂 . In most cases this could be an effective approach especially if you do not like to spend hours with JavaScript objects and arrays.

I didn’t stops at this station. Next stop jqPlot!

image jqPlot is a really well engineered solution, in some sense it has an approach similar to flot, but it has more plotting types (pies too!), a great documentation online and a lot of examples.

Here both data and configuration are JavaScript objects but are separated, two parameters on the drawing calls.

I appreciated the “default renderer” configuration so you do not need to write too much in case of multiple data series (unlike flot).

The other key factor of this library is the complete pluggability of the renderer; you can have renderers for axis, labels, ticks etc. This approach for instance makes it possible to have labels rendered by canvas:

image

The separation between data and configuration helped me to realize my Patapage widget.

imageI made an editable table that refreshes on-the-fly chart values and a set of options to change the graph layout. Both data and configuration are serialized, so to be easily stored server-side.

I have set up a playground in order to test my Graph component, that covers only few of  jqPlot features, but should give you an idea about this component.

For the sake of completeness I have to cite Google Chart API and  Yahoo YUI Chart Controls, that require to bind tightly with these too small players 🙂 . No thanks, next time maybe.

well engineered