It’s been a long time since I last published on this blog, I was very busy on building our Twproject Project Management Software better and better. We have just released version 6.2 with a new mobile interface… but I’ll be back on this in one of my future posts.
During the last two years we have collected several feedback from our customers, but improvements and fixes were made on the Twproject’s Commercial Gantt editor version only.
The commercial version has been always a step forward the open source one, so after two and half years the gap becomes unbridgeable and I needed time and funds to ferry the open source component to the new world 🙂
Thanks to WikiSuite, that funded the alignment, the new version has finally seen the light.
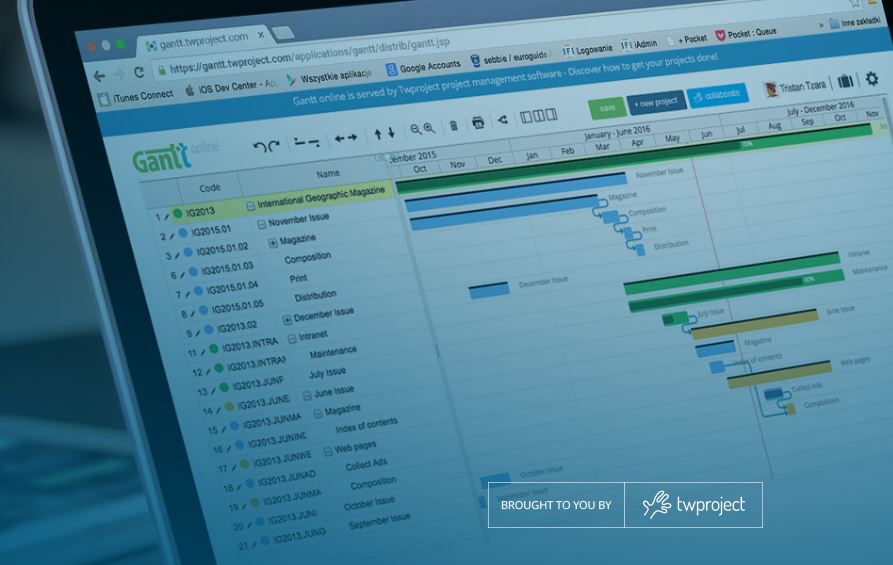
Twproject’s Free Gantt Editor has been completely redesigned, the look and feel has been improved and usability has been improved.
There is also a lot of work under the hood. In order to fix several “strange” issues on complex Gantt cases, in fact, we have included a sort of unit testing engine (see ganttTestSuite.js) that helped us identifying and fixing issues.
..and some other changes…
We have added new columns on the grid: progress and milestones.
Collapsed tasks’ status is stored as well as the column’s size. Double click on columns will give the best fitting size.
Task delete, indent, outdent, up, down are now available using the keyboard too; that speeds-up the project editing.
Several new permissions have been added to let jQuery Gantt editor working better on real environments.
Last but not least, the Gantt editor works fine with jQuery 3.1.


Super this new version.
Thank you for all this work.
Unless I am mistaken, I have found that if a task lasts 1 day, it can not be enlarged on the fly …
Yes, small tasks are hard to be resized. You should consider to zoom in.
Can you provide duration entry in decimals. e.g. 10.5 days. Currently it is rounding the duration.
Unfortunately duration is always integer in days.
It is possible to have a javascrip function trigered when the user changes dates on a task?
not exactly, but
there is the event “saveRequired.gantt” that is triggered when something changes and the event “addedTask.gantt” when a task is added.
Many thanks.
It would be great to have property to get only the changed data, to speed save operations.
In Safari 10.1, the demo gantt.html seems to have the columns on left panel with some problem on the headers. Columns widths are not the same as rows inside that panel.
Thanks,
Abilio
Thank you, this is a great solution. Is there a simple way to modify the application to only use a single resource per task?
Hi Joe,
yes, it should be quite easy, check the full editor composition and remove the add button and reduce the number of empty rows.
Hello, Roberto!
I’m Sergey from Siberia.
Thank you very much for your work!
I’m working with jQuery Gantt and have some trouble with https. There is void page in demo and in my test chart when https is on. Can jQuery Gantt working with https?
Thanks!
Yes, it works perfectly with https.
Try it here: https://gantt.twproject.com
Excuse me please. This solved. Its because of jquery.min.js and jquery-ui.min.js which loading with http (in your demo from github). And the browser blocks an unprotected connections.
Hi Roberto, great work! I’m a bit confused as to how start date, end date and duration work together. In my case I want to define tasks purely (or mostly) based on start and end date. However if I leave duration blank, it defaults to 1 and overrides the end date. I can’t calculate duration in advance however by simply going end-start, because of the weekends etc. Any ideas?
Hi Michael,
start, end and duration seem a mess, and actually they are 🙂
Start and end point to the corresponding millisecond, but cannot define the duration (in working days) because of sat, sun and holidays.
The component always recompute the end (and sometime the start too) considering duration and calendar; moreover dates are always changed to the first and last millis of the day.
So the end date is useless when loading the project but it is very useful when you save the project, because you can use it for db searches.
There is are a couple of functions added to the Date object:
Date.prototype.distanceInWorkingDays
Date.prototype.incrementDateByWorkingDay
that take cares about working days.
Hi Roberto,
thank you for sharing this great gantt editor!
If I plan a project in the future (a few month, January 2018 for example) the gantt chart starts always one week before today. There are a lot of empty weeks. Is there a simple solution to let it start with the project?
Thank you in advance.
Frederik
By default jQuery Gantt tries to show today.
If you want, you can swith off this feature modifying ganttDrawerSVG.js
setting
this.includeToday = false;
Hello Roberto,
Congratulations for your great software.
Is there any example loading dynamic data from json, csv or MySQL?
Thank you for your support.
Regards
Yes, there are some lines commented on the code that shows you how to implement server interaction.
There is no server-side examples.
The project file format is described here:
https://roberto.twproject.com/2012/08/24/jquery-gantt-editor/
Hi Roberto,
how can we set the width of split boxes? I have to show all the columns of gantt editor part by default. so i need to set width of splitbox1.
Just call: ge.splitter.resize([new % first box])
Hi Mr Roberto,
It is a great product of the Gantt Chart. It is free, but I would like to ask about the proper attribution. I dont mind to attribute, but are there several options? Thanks
Herry
About the attribution, for example, in the example of the downloaded zip file, after I open the html file, in the top left corner, there is logo “Gantt Online” which takes me to the Free Gantt TWproject. Can I change this so if User click, the user go to the real TW Project website with pricing etc. And in the right corner, can I just delete that? It only says “This Gantt editor is free thanks to … etc”.
Many thanks again, Sir.
Herry
Hi Herry,
just keep the initial lines for each .js file:
/*Copyright (c) 2012-2018 Open Lab
Written by Roberto Bicchierai and Silvia Chelazzi http://roberto.twproject.com
...
OF CONTRACT, TORT OR OTHERWISE, ARISING FROM, OUT OF OR IN CONNECTION
WITH THE SOFTWARE OR THE USE OR OTHER DEALINGS IN THE SOFTWARE.
*/
Dear Mr Roberto,
Thank you for your prompt response.
Herry
Hi Roberto,
first of all – thanks for your awesome work!
I would love to recommend it to one of my clients but they have two additional requirements:
– they are planning in hours
– react is their prefered frontend
Guess it woulnd’t be too hard to wrap the code in an react-component, but what about changing it to plan in hours?
Are we talking about 1-2 mandays for the change or is it more a complete rewrite ?
Where would you start to change it?
Kind regards
Marc
Yes, there is a PRO version.
Contact me rbicchierai a t twproject d o t com
Hello,
I must say nice software you have. can we get a version of the software the start and end timeline estimated in hours and minutes instead of calendar date?
Thanks
Yes, there is a PRO version.
Contact me rbicchierai a t twproject d o t com
Thanks for your swift response.
Hey Roberto,
Thanks for the awesome tool.
I am facing a problem with start and end date while integrating with my application. When page load first, the default dates are current date but after fully loading, start and end date show “1/1/1970”.
Is there something i am missing ?
Any suggestions will be appreciated.
Thanks
Set “start” and “end” in milliseconds. “startDate” and “endDate” are not used
Hi Roberto,
many thanks for your good tool. It looks nice and I like to use it.
How does duration, start, end and assigned workers fit together? I would estimate the more workers the earlier the task is ready but it seems not.
What’s the difference between worker and project manager in this case? Does every project needs at least a project manager _and_ a worker? -> a bit confusing for me
Is there any documentation? Or some FAQ, Howto’s, best practise, … ?
Hi Marcus,
there is no relation between duration and effort.
You can have very long task with no effort (eg. customer approval), and very short task with lot of effort.
Twproject, the application where jQuery Gantt editor comes from, shows in real time the resource load, so that the PM can balance duration and efforts (considering all the projects the resource is working on).
Hoping this helps.
Best regards,
Roberto
Hi Roberto
I understand the start / end date is recorded in milliseconds which is good. With regards to duration is there any limitation i.e. can we display the duration in minutes, hours, days, weeks, months, years?
Hi,
duration is in days only for the standard version.
There is a PRO version (not open source) with duration in days, hours, minutes and seconds.
If you want more info and price for the PRO version, write me directly (rbicchierai at open-lab dot com)
Is a milestone rollup possible? I want to show multiple milestones in one row. How could that be achieved?
not possible at the moment. Only start and end can be set as milestone
Hi Roberto,
I’m trying your code and it’s very nyce, but I’m facing with one issue on dates, I have my tasks with code JSON below with 3 lines that contains folowing data:
– Line 1: date start: 2014-11-27 ; date end: 2014-11-27
– Line 2: date start: 2014-11-28 ; date end: 2014-11-28
– Line 3: date start: 2016-07-22 ; date end: 2016-07-26
{“id”: 10, “name”: “”, “progress”: 0, “progressByWorklog”: false, “relevance”: 1, “type”: “”, “typeId”: “”, “description”: “Task 1”, “code”: “T1”, “level”: 0, “status”: “STATUS_WAITING”, “depends”: “”, “canWrite”: true, “start”: 1417050000000, “duration”: 1, “startIsMilestone”: false, “endIsMilestone”: false, “collapsed”: false, “assigs”: [], “hasChild”: false},
{“id”: 11, “name”: “”, “progress”: 0, “progressByWorklog”: false, “relevance”: 1, “type”: “”, “typeId”: “”, “description”: “Task 2”, “code”: “T2”, “level”: 0, “status”: “STATUS_WAITING”, “depends”: “”, “canWrite”: true, “start”: 1417136400000, “duration”: 1, “startIsMilestone”: false, “endIsMilestone”: false, “collapsed”: false, “assigs”: [], “hasChild”: false},
{“id”: 86, “name”: “”, “progress”: 0, “progressByWorklog”: false, “relevance”: 2, “type”: “”, “typeId”: “”, “description”: “Task 3”, “code”: “T3”, “level”: 0, “status”: “STATUS_WAITING”, “depends”: “”, “canWrite”: true, “start”: 1469145600000, “duration”: 5, “startIsMilestone”: false, “endIsMilestone”: false, “collapsed”: false, “assigs”: [], “hasChild”: false}
But when rows are loaded, the dates are many different, in the first and second line show the actual date (today) in start and end cell, and third line put 2020/05/04 in start date and 2020/05/08 in end date.
Can you help me to figured this out?
Tanks in advance.
there is a function for actualize data for demo purposes. Just remove it.
Hello,
First thank you for your very good work.
I understand that duration is only in days.
My problem : i can’t set two dependent tasks with the parent ending the same day of the child task starts.
For example :
Parent from 2019-01-01 12:00 to 2019-01-02 12:00
Child from 2019-01-02 12:00 to 2019-01-03 12:00
If I set this tasks, child is automatically moved to start on 2019-01-03.
Is there a config parameter to allow this ?
Thank you !
just set lag = -1
e.g: if task 2 depends on 1 set dependency like “1:-1”
Roberto
It works !
Thank you very much.