
Online Demo/Service and Sources |
There are two news for this release:
1) a new “Pupunzi-ed” skin
2) a new service for storing and sharing your Gantts
Stylish and clean skin by Pupunzi
August is the calmest month of the year, most of our customers are in holiday and we had the time to look to our products under a different POV (3D docet ![]() ). Matteo (alias pupunzi) told me: “your Gantt sucks!”. I replied: “Ok, do it better…..if you can”. And he did it!
). Matteo (alias pupunzi) told me: “your Gantt sucks!”. I replied: “Ok, do it better…..if you can”. And he did it!
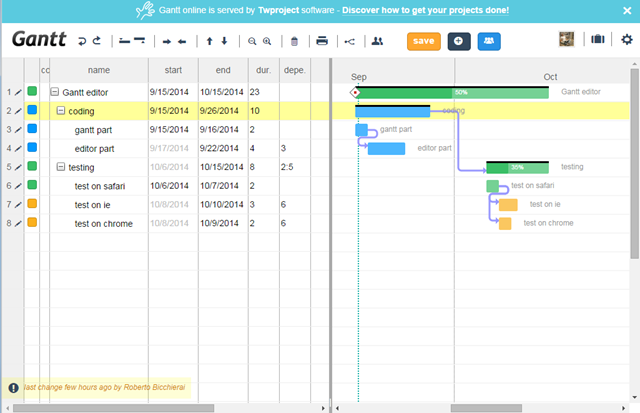
In the new skin, task statuses are more visible and everything uses media queries to better fit screen resolutions.
Another improvement is related to the scale and the splitter: positions are now stored on the project, so that you will open the Gantt on the same “visual” state.
We have also introduced a resource editor.
A nice feature is on project loading. Sometimes the json used for feeding the Gantt contains some errors; we made the loading process more robust to errors.
Some small bugs has been fixed too.
But the real great news is:
The on-line service
We worked on this component for a long time and we received lots of requests for implementing a “simple” service.
Here it is! Now you can test it online, and moreover you can share Gantts with your friends and colleagues and embed as many Gantts you designed.
Nothing changed to the license that was and still remains MIT!
There is a simple login that uses most commons socials: Twitter, Facebook, Google or Linked-in

We use socials for authentication purpose only (no post, e-mail or spam), but you can help us keeping the service free by “spreading the word” ![]() . Your project Gantts will be saved to your account for a private access.
. Your project Gantts will be saved to your account for a private access.
You can save as many Gantts you need. Here is a project list:

Project name is simply the name of the root of your Gantt.
You can show your Gantt to your friends/colleagues by using the “share” button:

Following the link anyone will be able to see your project (in read-only!), no login is required. Click here an example.
Moreover we created a widget to help including the Gantt in any page. Click on “embed”

Choose the size, and then copy and paste the code on your page. The widget will scale the content to adapt to the size.
If you want to export project data copy the share link
and replace “/project/” with “/data/”
http://gantt.twproject.com/data/O-09BFB15F84ADC3817D71FCC16E7F7330856A1792DA1E2D2F52BDFE0EC03DFBD1
Get more from your Gantt
As you know, a project is more than a Gantt, and mostly you get your project done by collaborating in team.
The free online Gantt service, is part of Twproject, a complete and easy to use project management solution where I’m the software architect.
You will find there in use several of my JavaScript components whose development I often describe on this blog.
With Twproject you can manage projects, tasks, issues, time tracking, resources, has powerful reports, shared agendas and lots more.
We have developed an easy to use import from Gantt so that you will see how your project works in a fully featured application.
Related Posts
-
 Twproject jQuery Gantt editor–new version and service
September 15, 2014
Twproject jQuery Gantt editor–new version and service
September 15, 2014
-
 jQuery Gantt editor – collapsible branches
May 15, 2014
jQuery Gantt editor – collapsible branches
May 15, 2014
-
 jQuery Gantt editor – bugfix: invalid project handling
August 31, 2012
jQuery Gantt editor – bugfix: invalid project handling
August 31, 2012
-
 jQuery Gantt editor – bugfix released
August 30, 2012
jQuery Gantt editor – bugfix released
August 30, 2012
We are trying to implement a gantt chart on a sharepoint project and your chart appears perfect. The only issue we have is that we require the end users to be able to see if the milestones changes, what the previous milestone was and why it changed as a popup.Is there a way to add multiple milestones to a single task.
What you need is to keep an history of task dates because for Twproject milestones always match a task start or end.
In the complete Twproject product we have such feature, but it is maintained server-side.
Does the Twproject jQuery Gantt editor work within Joomla as a component or plugin or module?
Thanks in advance.
I’m sorry, no idea…. actually it is a javascript component so it should, but I’m not sure Joomla is compatible with jQuery.
I’ve seen quite a few jQuery extensions for Joomla and Joomla has some wiki info on jQuery. So, the question is how to implement Twproject jQuery Gantt editor into my Joomla site. Any suggestions for someone new to jQuery? I’m not afraid to experiment; as I’m a novice coder.
Also, I actually discovered Twproject jQuery Gantt editor via GitHub related to Fabrik (a very nice Joomla DB management component); which I use within my site. It made me wonder if Twproject jQuery Gantt editor was written to work with Fabrik. Here’s the link: https://github.com/Fabrik/jQueryGantt
Thanks in advance.
I never used Joomla.
I’m sure you can use my component with it, but you should consider that once the component runs, you need to play with storing data server side somehow.
If the Fabrik guys forked my component from gitHub, you should refer to them in order to discover the best way to use it with Joomla.
Hoping this helps,
Cheers,
Roberto
Thanks Rob. Thant’s a good suggestion. I’ll reach out to Fabrik to see if they can help.
Hello Rob.
I’ve added the Gantt chart to my Joomla site using an iFrame to the gantt.html. Could I trouble you for any suggestions on how I could map gantt line item fields to my sites related MySQL database?
Thanks in advance.
Yes, you can, but I’m not used to PHP programming, so I’ll do my best 🙂
Great.
Thanks Rob. I look forward to seeing it.
Hi Rob.
How is the PHP programming coming?
Sorry, no pressure, I’m just looking forward to interfacing the gantt chart to MySQL DB.
Thank in advance.
No Bren, PHP will never coming. You have to code in PHP, I’ll try to answer your question 🙂
Sorry for the missunderstanding.
Oh ok.
On another note; is there a way to add a column with the percentage complete on each task (versus just on the task graphic)?
Also, can the sum of the percentage complete of sub-task items appear on the parent item? It seems redundant to have to manually adjust the percentage complete of a parent item that is full of sub-items.
Thanks in advance.
Next version will have the progress column and tons of new features (estimated release middle March).
Regarding the “propagation” of progress from children to parent is in general a bad idea for several reasons that can be summed up in this statement: “every child task can have different weight”. Only the PM can have the “feeling” of the progress.
Cool, thanks.
On another note; I’m planning on adding some PHP for my MySQL DB interface. Could I trouble you to point out what line # is the code is the save button click event located within with gantt.html?
Also, I changed a couple colors (like the weekends from pick to grey); but I’m having a hard time finding where the color of the orange save button is. Could I trouble you to point out where that in located; as I’d like to change the color to a light blue to match my website better.
Thanks in advance.
Hi Rob.
I found the save / load portions of code on the gantt.html file. I should of looked before asking. It would be nice if the JSON was also saved into a text or JSON file within the gantt folder (other than to the browsers local storage). Could I trouble you for some lines of javascript code to do so; as well as load from the saved file? I have experience with saving a JSON file to a MySQL DB via PHP; but Javascript is new for me and I’m trying to learn it fast with an e-course right now.
Thanks in advance. I hope to hear from you soon.
Hi Rob.
In regards to the new version in March; it would also be great to see a column for material cost. I look forward to seeing the next version.
Thanks in advance.
Hi Rob.
I’m still working on the PHP / MySQL interface; but in the mean time I have the Gantt Chart saving & reading the JSON to a text file on the server to allow for changes from multiple users (obviously not at the same time as the last to save will overwrite the other users changes).
On another note; I’ve been trying to figure out how to adjust the color Status transition rules. I found where I can change the status pop-up names (like “active” and “completed”); but I can’t figure out how to change the colors. I’ve tried to figure it out with FireBug and searching for Hexcolors; but have not had any luck. Any chance you could steer me in a direction (like to a file and line of code)?
Still looking forward to your March update.
Thanks in advance.
Hi Rob.
I’m still trying to figure out how to adjust the color Status transition rules. I found where I can change the status pop-up names (like “active” and “completed”); but I can’t figure out how to change the colors. I’ve tried to figure it out with FireBug and searching for Hexcolors; but have not had any luck. Any chance you could steer me in a direction (like to a file and line of code)?
Thanks in advance. I hope to hear from you soon.
gantt.css
search for .taskStatus[status=STATUS_ACTIVE]
Hoping this helps,
Cheers,
Roberto
Hi Roberto,
First; apologies for posting here.
I have a “basic” newbie question about the jquery gantt editor. I would like to use it in my jsf/primefaces application but find that it never gets rendered correctly. I have included all your css and javascript files as per your documentation.
My questions are:
1. Can I use it in JSF/Primefaces?
2. Can you help me have a look at what I may have done wrong. I’ll post the sources as you require them.
Hi Elton,
please post technical issues on the project page on github.
1) I don’t know jsf/primefaces
2) as from 1) probably not. Anyway a suggestion: check carefully that the template part is exactly like the one in gantt.html. Templates are inside the comment tags, so if you introduce line breaks or change the format it may cause the fail.
Hoping this helps.
Thank you so much, Rob. The task status color changes worked out great.
One more question, I would really like to change the format of the start and end dates from dd/mm/yyyy to mm/dd/yyyy. Any chance you could steer me in a direction (like to a file and line of code)?
Thanks in advance. I hope to hear from you soon.
i18nJs.js search for Date.defaultFormat = “dd/MM/yyyy”;
Thank you so much, Rob. That was easy. I really appreciate it.
I have one more question today. This one might be built into the gannt chart already; but I just don’t know how to do it. Is there a way to link one task to another task; but have a large gap of days, weeks, (etc) between the 2 linked tasks (versus the following day)?
Thanks in advance. I hope to hear from you soon.
Yes…. look closely to the image on top of this page 😉
Thank you so much, Rob. I thought there was a way. I just have to remember to add the colon and the same task number to apply it.
This looks great, I’m testing it to integrate this with an angular project. Just wanted to let you know I could not sign in to the online demo using google plus.
Google login is now working again.
Hi Rob.
I hope all is well and I’m hoping to see your next version of the gantt chart; which you mentioned you should be done with by mid-March.
On another note; I’m interested in trying to get the gantt chart print out on 1 large 11×17 page (instead of 2 pages). Any chance you could steer me in a direction (like to a file and line of code)?
Thanks in advance. I hope to hear from you soon.
We will probably delay the release (we will release it with the new Twproject version) up to June.
I never printed on a page larger than A4. In order to keep everything on the same page, check the ganttPrint.css, in particular
.splitBox2{
page-break-before: always !important;
}
Bummer on the delay.
Cool, I’ll check out ganttPrint.css and see what I can do.
Thank you, Rob. You have a great day.
Hi Rob.
So, I followed your suggestion; which removed the page break; but the the columns were still above the gantt chart. So, I made a couple other changes to ganttPrint.css and got the printout very close to what I’m wanting; with the chart beside the task columns. There is some slight overlap of the gantt chart on top of the resources column. Any suggestions on how I could show the resources column without the overlap?
Also, it would be nice if the print out started the gantt chart with today (instead of the start of the 1st task item). Any suggestions on how I can have the print out start the gantt chart from today (like how the gantt.html first displays on load)?
Thanks in advance. I hope to hear from you soon.
Hi Rob.
I’m still stuck on how to print out the Gantt Chart (graph portion) starting with today (instead of starting at the begining of the year when the 1st task starts). Any chance you could steer me in a direction (like to a line of code withn the ganttPrint.css)?
Thanks in advance. I hope to hear from you soon.
Have a look to centerOnToday function and before to print try to set a negative margin (eventually remove from print css the margin override)
Hi Rob.
So, I found the centerOnToday function within the ganttDrawer.js file. Are you suggesting that I add the following to the gantt.html file?
print(
var x = Math.round(((new Date().getTime()) – this.startMillis) * this.fx)-30;
this.element.parent().scrollLeft(x);)
If so, could I trouble your for a suggestion on how do I apply x to the ganttPrint.css to set the negative margin?
Thanks in advance. I hope to hear from you soon.
Hi Rob.
So, am I headed in the right direction with trying to get the gantt to print with starting with todays date (as mentioned in my previous reply)? If so, could I trouble your for a suggestion on how do I apply x to the ganttPrint.css to set the negative margin?
Thanks in advance. I hope to hear from you soon.
Hi Rob.
I tried something different. I removed a bunch from the ganttPrint.css and only left the following:
.noprint {
display:none !important;
}
BODY, TBODY {
font-family: arial;
font-size: 12px;
margin: 0px;
color: #000;
overflow: visible!important;
}
.teamworkIcon{
display:none;
}
.mainColumn{
width:98% !important;
}
I like the way this looks; as it provides a nice 3 week look ahead. The problem is that the print out cuts off the rest of the gantt chart and table as it continues down the page.
I would be perfect if it could continue with the rest of the task items down the page.
Any chance you could steer me in a direction (like some code to add to the ganttPrint.css)?
Thanks in advance. I hope to hear from you soon.
Hi Bob.
I got the print out of the gantt chart to look the way I needed. It looks great; but the grey header row (start, end, dates) and the grey task description that appears after each gantt colored chart line are too light on the print out. Any chance you could steer me in a direction to darken these to something closer to black (like to a line of code withn the ganttPrint.css)?
Thanks in advance. I hope to hear from you soon.
Hi Bob.
I’m using the “canWrite” = false for some task rows that the user shouldn’t be changing. It’s working well; but this makes this task row too light of a font color. I would like to do something different and make these rows appear black & bold.
Any chance you could steer me in a direction to make the “canWrite” = false task rows appear black & bold (like to a line of code within the gantt.css)?
Thanks in advance. I hope to hear from you soon.
Have a look around line 300:
input[readonly]{
color: #c0c0c0;
}
Thanks Bob. That worked great.
Any news on the next update? You mentioned possibly June.
Hi Bob,
Could I separate the gantt.html into two page(one is GridEditor,another is Gantt Chart)?How can I do that?
Hi Garrick
Uhmmmm. It seems very hard. Grid and gantt are tightly linked.
Probably the easiest approach could be hiding on part at time.
Hi Rob
Is it reasonable to disable Grid scrolling?
How could I enable Grid scrolling?
Hi Rob!
Is there any know issue with the Gantt not loading correctly in a tab that’s not in focus when the page loads?
Indeed not.
Thanks for the reply!
The thing is that it loads all the resources from the server and there are no console errors, but some part of JS doesn’t work well, for example, the part that sets the table divider in inner HTML. Only when i click the divider, the left part “draws”, but there is no right part of the Gantt. When i zoom in/out, the right part shows… Weird.
Dear Rob,
I see there’s a limitation of 30 tasks per project.
How can I alter that option? Couldn’t find the definition in your source…
Thanks in advance!
Eddie
There is no limit, it you starts with 30 empty lines, but you can add as many sub-task you need.
Evening Rob,
I see my Chrome Canary’s console saying “SVGElement.offsetParent’ is deprecated and will be removed in M50, around April 2016. See https://www.chromestatus.com/features/5724912467574784 for more details.
base.js:3467 SVG’s SMIL animations (, , etc.) are deprecated and will be removed. Please use CSS animations or Web animations instead.”
Does this mean our gorgeous Gantt will simply die in next 4-5 months?
Hi,
this is not an issue of the Gantt by itself, but it comes from jQuery 1.8.3
I had a new version that uses jQuery 2.1.3 with no issue, but I’ve not time to release it 🙁
I hope to release a new version soon; stay tuned.
Does jQuery Gantt support “off days” for resources? or is there a workaround for this?
PS:I need to modify the program in order to show a Resource graph, where any task is shown as a child of the parent(the resource), any indication where I need to start looking?
Does this library support multiple tasks on the same row? This way it could be used as a timeline component as well.
Strange question 🙂
Usually on Gantt every task is on a different row.
The answer is: no.
This is mainly an editor, you cannot adapt it for timeline visualization.
Very cool Gantt chart, however, if you have 50,000 tasks it attempts to render every single row, and draw the entire SVG map!
Have you considered implementing a simple clipping algorithm so that items not visible are quickly discarded and not rendered??
If you have 50.000 tasks……. this is not the right component.
Yes, I considered such solution, but considering that our standard project size is less than 100-200 tasks it fits perfectly our needs 🙂
Anyway is you like to improve the component you could contribute branching it on github.
If your changes will result well identified and not-invasive I’ll be happy to merge the source code.
How can we add week-end and holidays also.
i removed some line of code in date.js file but still it is not adding saturday, sunday and holidays too.
at the time of showing end date is not matching to database actual date
How can we add week-end and holidays also.
i removed some line of code in date.js file but still it is not adding saturday, sunday and holidays too.
at the time of showing end date is not matching to database actual date
have a look i18n.js file to the isHoliday() function
Hello Vidya,
i saw that you have continuous conversation with Rob
can you share one of my problem of Gantt chart to Rob or if you can help. you are mostly welcome.
issue is,
I have more than 100 record , but when i am modifying startdate /enddate /duration. it’s taking too much time to update its all parent from last to first.
I have been modified Gantt chart very much like, I added two dropdown to select assign user to each task,
Progress and Budget column of each task.
but only when modifying dates, it’s taking too much time.
Please do not use this thread for technical question.
Use https://github.com/robicch/jQueryGantt
Hi Rob,
Is there a way I could do filtering based on a column (for Ex: Status) ? I mean , if i have a hover dropdown control in GanttButtons and when i select a status based on that the records in the Gantt to be filtered. It would be great if you can provide direction as to which file I need to look into. Thanks for your help !
Hi,
filtering is not supported.
I see a couple of main problems implementing this feature:
1) row numbering: have a look to collapse feature, probably will give you some hints
2) children: if a child task match the filter but parent not; what to do?
2) dependencies: when you filter you will need to hide rows, how to manage links?
Cheers,
Roberto
Thanks so much for the quick reply Rob. Let me explain the scenario which we are planning to implement,
Create one task for a Project with different phases/milestone levels for it .Indicate different Phase start and end dates in the same project Gantt rectangle something like
Project will have a Gantt with 3 colors from Aug 1 to Sep 30
Phase1 : Aug 1 2016 to Aug 10 (Indicate that portion of Gantt with say Green Color)
Phase2 : Aug 15 2016 to Aug 30 (Indicate that portion of Gantt with say Purple Color)
Phase3 : Sep 1 2016 to Sep 30 (Indicate that portion of Gantt with say Yellow Color)
Instead of having a Parent/Child relationship , can we represent it this way by tweaking the code ? Is this possible at all ?
this could be a solution, but it not a gantt 🙂
Of course you can tweak the code…. lot of tweak 🙂
2016-08-25 10:57 GMT+02:00 Eltit Golb :
>
Hi Rob,
We have customized this control in such a way that for every task we have multiple gantt bars(min 7) with different colors are drawn.We are having more than 100 tasks for a Project(every project is a row ) and
While Gantt is getting generated Screen is getting Hang in IE
Please help us in resolving screen hang issue
Hi Robert,
Im trying to understand the Start Date and End Date formating in the sample data given
For taskid = -1 you have given Start Date as 1396994400000(milliseonds) and end date (1399672799999) duration : 21 days
When I try to convert dates to normal date format it shows as Wed Apr 09 2014 06:00:00 GMT+0800 but in gantt it shows as 05/09/2016. I’m not really sure how this calculation is done ? It would be great if you give some pointers. I have to work with around 10 datetime fields for each task, this understanding is very important for me.
Note: My Time Zone is UTC+8 (Kaulalampur,Singapore)
Thanks much
In Twproject “duration” is calculated in working days, so, by default, sat and sun are skipped.
there’s something I don’t get: why does the left side only have a maximum number of empty rows? I mean the ones you can edit to add more items.
wouldn’t it be better to always leave at least 1 blank row? I have a gantt with more than 50 rows and for this reason I can’t add any by hand, because there are no more empty rows at the bottom.
I know there are two buttons to add a new row but neither of them adds a new one to the bottom, at level 0. it’s either above the current row or below it but at level 1 (or better, “level of the current row” + 1).
I expected it to act like in SQL Server Management Studio or SQL Developer in which a new empty line is always present at the bottom, to add a new row.
Hi Pietro,
for my purposes 50 rows are more than necessary :-).
Moreover, this is a free component released open source, so that everyone can contribute getting it better.
If you don’t like the behavior, just put your hands on the code and change it.
P.S.: SQL Server Management studio is developed with a larger team and more budget.
yeah I’ll probably edit it but it seemed such a no-brainer to me, that I was surprised that it wasn’t so.
I hope I didn’t sound aggressive or something.
Hi Roberto,
I need to attach files to each task in the gantt,please can you tell me how can i do this?I know it’s like adding a new column and adding a new field to the json data.But can you tell me which all files need to be edited for this to happen?
In order to attach files, you will need to upload them to the server.
It is not so easy as it seems. You will face with FormData JS object and browser compatibility very soon 🙂
Have a look to one of the thousands html5 upload components in order to understand how it works.
Good luck!
Hi,
I am facing an issue while loading the saved resources for tasks.The resources added are shown in the listing of all tasks,but when i try the edit of a task,there is no resource selected there and the console shows an error “jquery.JST.js:99 JST error: ASSIGNMENT_ROW obj.assig.id.indexOf is not a function”.Please reply back it’s urgent
Probably task assignment data are corrupted, incomplete or invalid. Check that resources id matches with the one reported on assignment.
Hi Rob,
I’m trying to understand what is the exact purpose of these below utility functions . Im sending the inputs in milli seconds ,for ex: start =1481241600000 end = 1482969600000. I want it to display in the same way, but when the code runs, it adjusts the end date and changes it. Could you please help me understand what exactly does these functions do and which scenario this would be useful ?
function computeStartDate(start) {
var d = new Date(start+3600000*12);
d.setHours(0, 0, 0, 0);
//move to next working day
while (isHoliday(d)) {
d.setDate(d.getDate() + 1);
}
d.setHours(0, 0, 0, 0);
return d;
}
function computeEndDate(end) {
var d = new Date(end-3600000*12);
d.setHours(23, 59, 59, 999);
//move to next working day
while (isHoliday(d)) {
d.setDate(d.getDate() + 1);
}
d.setHours(23, 59, 59, 999);
return d;
}
Task duration is in workind days and a task at least last for one day, so the code set the start date to the first millisecond of a day, increment the date in workinf days then set the end to the last millisecond.