jQuery Gantt editor – bugfix: invalid project handling

jQuery Gantt editor – bugfix: invalid project handling

Online Demo

Download Sources

We worked on the strange behaviour when loading a project with invalid data/structure  and we released a new version

Bug fixed:

  1. if project loading fails for invalid/incomplete data, you loose the control of the  application
  2. you can restrict parent changing duration even if not allowed by constraints: e.g.: a larger child

Improvement:

  1. better snap-to-grid moving tasks
  2. better feedback if project loading fails

jQuery Gantt editor – bugfix released

jQuery Gantt editor – bugfix released

Online Demo

Download Sources

After few days of “massive debugging” we released an upgraded version of jQuery Gantt editor. (try it)


Bugs fixed:

  1. an ugly bug when using the editor with a western time-zone: GMT-n (e.g: USA, Canada, South America etc.).
  2. an invalid message call when a circular reference was created that force  js execution to stop
  3. no detection for avoiding a parent depending on its descendant

New feature:

  1. dependencies now supports lags: you can specify a dependency in the form of “7:3” that means the task will start after three days task “7” is completed

I’ve upgraded the component documentation: http://roberto.twproject.com/2012/08/24/jquery-gantt-editor/

Try the demo here http://gantt.twproject.com/

Feedback welcome!

jQuery Gantt editor

jQuery Gantt editor

Online Demo

Download Sources

As promised in my last post, here I will try to explain how to use our jQuery Gantt editor, how it works and how to customize it for your needs.

First let me list its key features:

  • jQuery based
  • MIT licensed: you can reuse it everywhere
  • json import-export
  • internationalizable
  • manage task statuses –> sort of workflow handling
  • manage dependecies
  • manage assignements (resources, roles, efforts)
  • server synchronization ready
  • full undo-redo support
  • cross browser (at least for recent versions)

Source codes are available on GitHub here: https://github.com/robicch/jQueryGantt

In order to better understand this component I will introduce some concepts below.

Genesis

This editor has been created mainly as part of our project management solution, Twproject.

During the development we always kept in mind creating an open-source reusable “component”, while the focus was integration with Twproject. This constraint gave us the opportunity to extend the standard Gantt behaviour by introducing key features like task’s statuses, or time buffers for parent tasks.

This is not the right place to discuss how these features make project modelling and management more flexible and closer to the real world: if you want go deeper have a look at Twproject user guide.

If Twproject’s model influenced the behavior of the editor, the environment where Twproject lives (Java Jsp Html5  jQuery internationalized server side multi-db cross-operating-system etc.) influenced the packaging and the libraries of our editor; this is the reason for so many dependencies.

Despite this facts, our Gantt editor can be easily customized and extended as Javascript component.

Main concepts

While a Gantt viewer (hence read-only) can be easily packed as a single component, a Gantt editor is a way more  complicated object; so I prefer to think of it as jQuery application and not just as a plugin.

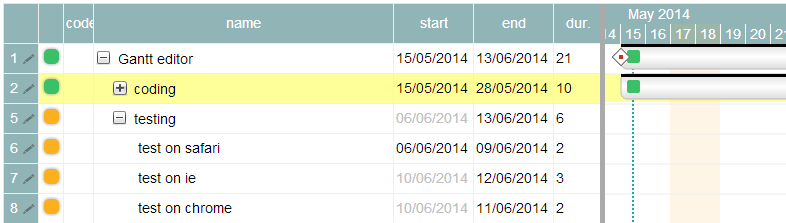
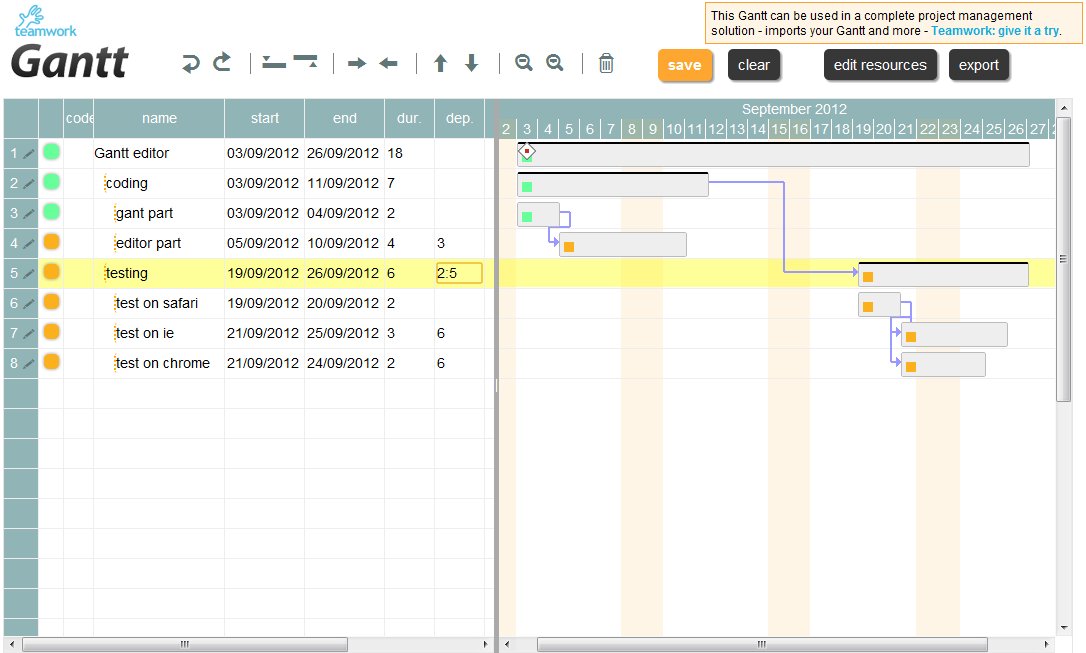
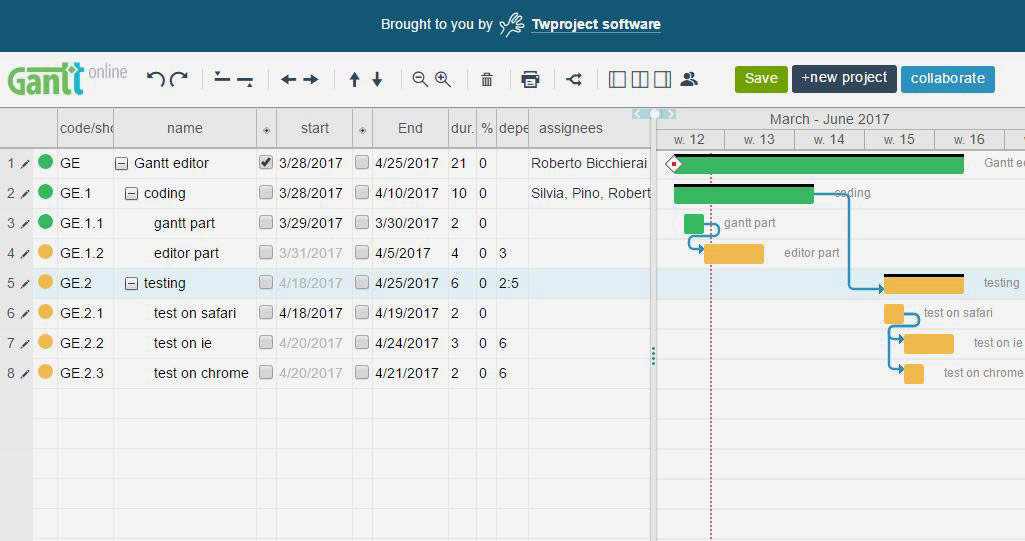
Actually our Gantt editor is composed by three main sub parts/editors: the grid editor on the left, the Gantt editor on the right, and the detailed task editor in popup; actually the popup editor is used also for resources and assignments.

The goal of our editor is to generate a json file representing the full project state that could be sent to a server to store it. During editing there is no interaction with the server.

The distributed version uses local storage to save the project status, but examples of server calls are available in the source code.

How to use it

Download the component source code here, unzip the file: the “gantt.html” is already a working Gantt editor. If you open “gantt.html” with your preferred html editor: the source contains some comments so it should be readable Smile .

To play with the code use Firefox with Firebug plugin installed or Chrome (as I do).

In the code first we defined a global variable for accessing the editor, called “ge”.

In your browser try to change something on the gantt and then from your js debugger execute

ge.saveProject()

This method returns the project in form of a json object. In the demo page we use local storage for saving the project (or a textarea if local storage is not available), but in a real environment you probably will need to send data to a server. I left a commented code for ajax communication with the server.

In order to load a project you must obviously supply a json object in the same format that has been saved on the server:

ge.loadProject( <em>[yourJsonProject] </em>)

The same json object can be used both ways: load or save, and in consequence client-to-server or server-to-client.

Project data structure

This is a project json object structure:

{
tasks:[…]
resources: […]
roles: […]
… more
}

here  tasks, resources and roles are arrays.

As it easy to guess, the “tasks” array contains a list of task in the Gantt, and this is the most relevant data to manage.

“Resources” and “roles” will be easy to understand by looking first to a task element in the “tasks” array:

{
"id":"tmp_fk1345562123031",
"name":"approval",
"code":"APP",
"level":2,
"status":"STATUS_SUSPENDED",
"start":1348696800000,
"duration":10,
"end":1349906399999,
"startIsMilestone":false,
"endIsMilestone":false,
"assigs":[…],
"depends":"7:3,8",
"description":"Approval of testing",
"progress":20
}

First important consideration: the order of tasks in the array is the same of the editor. The index of the array is used as reference for dependencies.

Attributes like name, code and description require no explanation, but some do:

  • id: used to synch data with the server. If the id is supplied by the server it will untouched. Tasks created client side will acquire a temporary id starting with  “tmp_”
  • level: it is the depth (the indentation) of a task in the Gantt structure. The root task is at level 0 (zero), its children at level 1 (one) and so on. Levels must be consistent with the project structure: you can’t have a task of level n+1 if you don’t have a task of level n above on the array
  • start, end: are expressed in milliseconds. “start” is set to the first millisecond of the day, “end” is set to the last millisecond of the day.
  • duration: is always in working days. If there are holidays on the calendar (see below for  holydays configuration) the end date will take it into account. Actually the end date is always recomputed using “start” and “duration”, and it is supplied for comfort  Smile
  • startIsMilestone, endIsMilestone: booleans. Once set to true, task’ start/end can’t move accidentally. You always can change dates directly on the task, but not by acting on children or predecessors.
  • depends: a string comma delimited containing indexes of tasks on which this task depends. Multiple dependencies are supported. Only the finish-to-start dependency type is supported (other types can be workarounded by introducing intermediary brother tasks or children). It is possible to specify a “lag” in days by using a “:”. E.g.: 7:3,8 means that the task will start 3 days after task 7 is completed and task 8 is completed.
  • status: this is a string representing the status of the task. Allowed statuses are: STATUS_ACTIVE, STATUS_DONE, STATUS_FAILED, STATUS_SUSPENDED, STATUS_UNDEFINED. As stated before, task statuses allow to use your project like a sort of workflow: e.g.: if “task b” depends on “task a”, “task b” will remain in “STATUS_SUSPENDED” until “task a” will pass from “STATUS_ACTIVE” to “STATUS_DONE”. For the complete status transition rules see below.
  • progress: a number that specifies progress: 0%  none 50% half way and so on. For Twproject in some case 123% can be a meaningful value for progress, so there are no constraints.
  • assigs: array of  assignment. Each assignment has the following structure:
    {
    "resourceId":"tmp_1",
    "id":"tmp_1345560373990",
    "roleId":"tmp_1",
    "effort":36000000
    }

mainly assignments are structured for carrying server-side  data:

  • resourceId: is the unique id for the resource. Refers to the “resources” array
  • id: is the unique identifier of this assignment
  • roleId: is the unique identifier of this assignment. Refers to the “roles” array
  • effort: is the estimated effort in milliseconds

The “resources” array contains elements in the following form:

{
"id":"tmp_1",
"name":"Resource 1"
}

The “roles”  array contains elements in the following form:

{
"id":"tmp_1",
"name":"Project Manager"
}

You must remember that this editor is the client part of something that manages persistence, alerts, interaction with other systems server-side; so we have to handle a few more attributes:

deletedTaskIds:[…]
selectedRow: 7
canWrite: true
canWriteOnParent: true
minEditableDate:1349906300000
maxEditableDate:3499063999999

where

  • deletedTaskIds: is an array containing the ids of the tasks removed client side. Only tasks with a “real” id will be notified to the server (so not those starting with “tmp_”), locally generated ones will be removed silently.
  • selectedRow: is the line currently in edit
  • canWrite: is a boolean stating if you have permission to write/change/create/delete tasks on this project or not. Set it to true for a basic usage.
  • canWriteOnParent: this is a little bit obscure. It is used in case you are editing only a small part of a complex project. For instance  you are a PM of  sub-task but not of the top-project: maybe some changes you made on dates may affect the top-project schedule.
    Setting this boolean to false you will stop propagation to top project/s. Set it to true for a basic usage.
  • minEditableDate, maxEditableDate: are the boundaries used in case you can’t  write on parent

Here is an example a the project json object:

{
"tasks":[
{
"id":"tmp_fk1345624806538",
"name":"Gantt editor ",
"code":"",
"level":0,
"status":"STATUS_ACTIVE",
"start":1346623200000,
"duration":5,
"end":1347055199999,
"startIsMilestone":false,
"endIsMilestone":false,
"assigs":[
{
"resourceId":"tmp_3",
"id":"tmp_1345625008213",
"roleId":"tmp_1",
"effort":7200000
}
],
"depends":"",
"description":"",
"progress":0
},
{
"id":"tmp_fk1345624806539",
"name":"phase 1",
"code":"",
"level":1,
"status":"STATUS_ACTIVE",
"start":1346623200000,
"duration":2,
"end":1346795999999,
"startIsMilestone":false,
"endIsMilestone":false,
"assigs":[
{
"resourceId":"tmp_1",
"id":"tmp_1345624980735",
"roleId":"tmp_1",
"effort":36000000
}
],
"depends":"",
"description":"",
"progress":0
},
{
"id":"tmp_fk1345624789530",
"name":"phase 2",
"code":"",
"level":1,
"status":"STATUS_SUSPENDED",
"start":1346796000000,
"duration":3,
"end":1347055199999,
"startIsMilestone":false,
"endIsMilestone":false,
"assigs":[
{
"resourceId":"tmp_2",
"id":"tmp_1345624993405",
"roleId":"tmp_2",
"effort":36000000
}
],
"depends":"2",
"description":"",
"progress":0
}
],
"resources":[
{
"id":"tmp_1",
"name":"Resource 1"
},
{
"id":"tmp_2",
"name":"Resource 2"
},
{
"id":"tmp_3",
"name":"Resource 3"
}
],"roles":[
{
"id":"tmp_1",
"name":"Project Manager"
},
{
"id":"tmp_2",
"name":"Worker"
}
],
"canWrite":true,
"canWriteOnParent":true,
"selectedRow":0,
"deletedTaskIds":[],
}

Status transition rules (aka project workflow)

Task statuses are a key feature of Twproject, and our Gantt editor supports them in full.

Use the demo page and try to close some tasks (change status to “completed”); you will see how dependent tasks/children will change their status according to the following rules:

  • any status-> STATUS_DONE:  may activate dependent tasks, both suspended and undefined. Will set to done all descendants.
  • STATUS_FAILED -> STATUS_DONE:  do nothing if not forced by hand.
  • STATUS_UNDEFINED -> STATUS_ACTIVE: all children become active, if they have no dependencies.
  • STATUS_SUSPENDED -> STATUS_ACTIVE : sets to active all children and their descendants that have no inhibiting dependencies.
  • STATUS_DONE -> STATUS_ACTIVE: all those that have dependencies must be set to suspended.
  • STATUS_FAILED -> STATUS_ACTIVE: nothing happens: child statuses must be reset by hand.
  • any status-> STATUS_SUSPENDED: all active children and their active descendants become suspended. when not failed or forced
  • any status-> STATUS_UNDEFINED: all active children and their active descendants become suspended. when not failed or forced.
  • any status-> STATUS_FAILED: children and dependants are set to failed.

A basic minimal implementation

The demo example is quite simple and commented, it should the right point to start.

Here I’ll sum-up what you’ll need to use our Gantt editor in your application:

first include javascript dependencies

<script src="/jquery/1.7/jquery.min.js"></script>
<script src="/jquery-ui.min.js"></script>

<script src="libs/jquery.livequery.min.js"></script>
<script src="libs/jquery.timers.js"></script>
<script src="libs/platform.js"></script>
<script src="libs/date.js"></script>
<script src="libs/i18nJs.js"></script>
<script src="libs/dateField/jquery.dateField.js"></script>
<script src="libs/JST/jquery.JST.js"></script>

<script src="ganttUtilities.js"></script>
<script src="ganttTask.js"></script>
<script src="ganttDrawer.js"></script>
<script src="ganttGridEditor.js"></script>
<script src="ganttMaster.js"></script>

then some css

<link rel=stylesheet href="platform.css" type="text/css">
<link rel=stylesheet href="libs/dateField/jquery.dateField.css" type="text/css">
<link rel=stylesheet href="gantt.css" type="text/css">

then you need a div where to place the editor, something like:

<div id="workSpace" style="padding:0px; overflow-y:auto; overflow-x:hidden; border:1px solid #e5e5e5; position:relative; margin:0 5px; width:1024px; height:800px;"></div>

now create the Gant editor and bind it to your div

var ge = new GanttMaster();
ge.init($("#workSpace"));

your editor its ready to use.

If you want to know how our Gantt editor works, go in depth by reading next chapter…

How it is built

Environment first!

Libraries

Our Gantt editor is based on jQuery and use some jQuery UI components like draggable, sortable etc.

Other jQuery related libraries are used here like livequery and timers.

For data selection I used one of  my components (I have not yet published it but I will…; anyway its included here):

imageimage

It supports date shortcuts like “t” (today), “y” (yesterday), “lm” (last month), “lq” (last quarter), “-4w” (4 week ago)  and so on. See files on “/libs/dateField” folder for details. This component is MIT licensed so use it!

Another key component is a javascript template library called “JST” that I wrote some years ago and discussed in a previous post “Easy going JavaScript templates”.

It is used for creating editor side rows and Gantt task elements. The library is in “/libs/JST” folder; it is very powerful and I used it in several products.

Our Gantt editor uses extensively date computation and formatting.

I used Matt Kruse’s date library with some extensions for managing holidays in date computation and with some changes for more comprehensive support of Java date formats and internationalization.

Our Gantt editor supports internationalization, but only English is implemented. Have a look at “/libs/i18n.js” file. Here you will find all the internationalization defaults, including the definition of a sample holidays calendar.

The last library used is “/libs/platform.js” that is a sort of toolbox for input validation, feedback management, extension of js objects (String, Array, Date) for cross-browser compatibility and other tricks.

I’m not very proud of this library and I cleaned it up many times with the secret hope to remove it completely, but it is very tightly linked to our “historic” development environment; if I had to fork the Gantt from our platform it would become difficult to maintain.

Core objects

We have now arrived at the application’s core.

We divided the editor in three parts:

  • the GridEditor object that manages the left part of the editor. Data editing is managed here.
  • the Ganttalendar (sorry for the ugly name!) object that manages the right part of the editor with Gantt drawing, calendar scale, task date movement
  • the GantMaster object that is responsible for the coordination of both sides, transactional management, event management and persistence.
    Your code should “talk” only with this object.

These objects are in the gridEditor.js, gantDrawer.js and gantMaster.js files respectively.

The entities managed are: Task, Link, Resource, Role, Assignment, and are defined in ganttTask.js file.

Events

Once the Gantt Editor has been initialized

var ge = new GanttMaster();
ge.init($(“#workSpace”));

it binds some events on the DOM object, in this case the DIV “workspace”.

Events bound are:

  1. refreshTasks.gantt: perform a redraw of all tasks
  2. refreshTask.gantt: accepts a task as parameter. Redraw the passed task:
  3. deleteCurrentTask.gantt: delete the current selected task
  4. addAboveCurrentTask.gantt: add a task above the current ones. The task inserted will be a brother of the current one
  5. addBelowCurrentTask.gantt: add a task below the current ones. The task inserted will be a child of the current one
  6. indentCurrentTask.gantt: the current task will become a child of the task above
  7. outdentCurrentTask.gantt: the current task will become a brother of the task above
  8. moveUpCurrentTask.gantt: the current task (and its own children) will be moved up
  9. moveDownCurrentTask.gantt: the current task (and its own children) will be moved down
  10. zoomPlus.gantt: restrict  the time scale of the Gantt side (more detail)
  11. zoomMinus.gantt: enlarge the time scale of the Gantt side (less detail)
  12. undo.gantt: undo the last actions performed
  13. redo.gantt: redo last actions

A basic usage for triggering an event will look like:

$('#workSpace').trigger('zoomMinus.gantt');

When you perform an action in the project tree, the action could propagate along the tree. There are many constraints that must be respected like milestones, statuses, dependencies, boundaries and so on. Every constrain could make it impossible to complete the operation so we decided to wrap tree operations with a  “transaction”; in case of constraint violation we rollback all the changes already done.

Events are transaction-safe, so you don’t need to worry about them.

Methods

The GanttMaster object exposes some useful methods you may need for your application.

Be careful: unlike events, methods exposed are “low-level”, so you are responsible for managing transactions correctly; transactions are not managed unless otherwise specified.

Here is a list of most important methods:

init (jQueryDomObject)

description: creates the Gantt editor, initializes project arrays, binds events.

jQueryDomObject: is a jQuery proxy for a DOM object tipically a <div> where you want to create the Gantt editor

return: nothing

createTask (id, name, code, level, start, duration)

description: creates a Task object. The task created is not added to project, just created

id: task id
name: task name
code: task code
level: task indentation level. Root task is 0 (zero)
start: the task start date in millisecond
duration: task duration in days

return: the task created

createResource (id, name)

description: creates a Resource object. The resource created is not added to resource list, just created

id: resource id
name: resource name

return: the resource created

addTask (task, row)

description: adds a task to the project at the specified row

task: a Task object
row: row where to add the object, zero based

return: the task added

loadProject(project)

description: loads a project on the editor. This method is transaction safe.

project: a project in json format as above defined in “Project Data Format” section.

return: nothing

saveProject()

description: gets the project in json format as above defined in “Project Data Format” section

return: the json object

loadTasks(tasks,row)

description: adds tasks to the current project from the specified row on

tasks: an array of Task object
row: row where to start adding tasks, zero based

return: nothing

getTask(taskId)

description: retrieves a task by id

tasksId: the id of the task you want

return: a Task object

getResource(resourceId)

description: retrieves a resource by id

respurceId: the id of the resource you want

return: a Resource object

changeTaskDates (task, start, end)

description: changes scheduling for a task in the project

task: task you want to change
start: the task start date in millisecond
end: task end in milliseconds

return: true if changing was performed, false if changes required are invalid. Error codes are set on current transaction.

moveTask (task,newStart)

description: moves a task to a new starting date

task: task you want to move
start: the task start date in millisecond

return: true if changing was performed, false if changes required are invalid. Error codes are set on current transaction.

updateLinks(task)

description: updates project link structure as defined in “task.depends” property

task: task you want to change

return: true if changing was performed, false if changes required are invalid. Error codes are set on current transaction.

taskIsChanged ()

description: notifies GanttMaster that a task has been changed and enqueues a request for redrawing both sides. Redraw is executed asynchronously and only once after 50 milliseconds

return: nothing

redraw()

description: redraw both sides. Redraw is executed immediately

return: nothing

reset()

description: starts a new project and empties both sides

return: nothing

showTaskEditor(taskId)

desciption: shows the complete task editor in popup

taskId: the id of the task you want to edit

return: nothing

undo()

description: undoes the last operation performed. There is no limit to the number of operations (the limit is just the memory of your browser)

return: nothing

redo()

description: redoes last operation undo-ed

return: nothing

beginTransaction()

description: saves the current state of the project in memory. Transactions cannot be nested

return: nothing

endTransaction()

description: closes the current transaction by making changes performed active. If there are errors set on the transaction, it rollbacks to previous state

return: true in case of  successful commit, false if a rollback was performed

setErrorOnTransaction(errorMessage, task))

description: sets an error message related to a Task object in the current transaction. If no transaction is started the message is displayed on console instead.

errorMessage: a string containing the error message

task: the Task object that generates the error

return: nothing

Customization

The Gantt editor uses CSS so you can play customizing your Gantt editor look-and-feel.

Regarding internationalization, the question is a little bit complicated. As I’ve already said, actually only the English version is available.

The file “libs/i18n.js” is used for managing generic language/country specific data.  There you can change the values for month names, day names, currency format, date format and some default message strings. Actually in our real environment (Twproject) this file is server-side generated in base of user’s language settings.

In the same file you can/must change the implementation of the method isHoliday(date) that is used for taking care of  working days. The current implementation supports both fixed holydays (like Christmas) and mobile ones (like Easter), but you can refine the implementation for your needs.

Gantt specific string are set on GanttMaster.messages object, and by default its values are in English: you can implement you own language.

Recycling

There are lots of “tools” that can be reused; here is a list of some that I think may save a lot of time to developers:

JST: a javascript templating system, see here previous post “Easy going JavaScript templates”, but the version in Gantt is the updated ones (read until my last comment in the post linked!)

DateField: a jQuery calendar input component. No frills!

Date/Time: lots of functions that support multiple formats, relative dates, shortcuts etc. The changes from Matt Kruse’s date library should be really useful for Java developers, and in general my version is a little bit more complete, even if the original its great by itself!

Gridify: a jQuery component that transforms a <table> making columns resizable. See it at work on the left side of Gantt editor

Splittify: a jQuery component that creates a splitter in a specified dom element. Used for splitting the editor from the Gantt part

Transaction, undo-redo:  the idea and the implementation is very basic, so it can be used in many contexts

Profiler: a helpful tool for monitoring your javascript code performance

Field validation: validation function for email, url, date, time, integer, double, currency etc.

Everything is MIT!

I’m not sure if anyone can be interested on this stuff so for the moment that’s all, but in case someone is interested I’ll be pleased to publish a new post about them.

Every feedback will be really appreciated.

The JavaScript Gantt odyssey

The JavaScript Gantt odyssey

An “extended” overview of available JavaScript Gantt components…. and more

I cant believe it; I did it again!

I promised, but can’t resist……. I should have known it!

But let’ start from the beginning.

O course all of you know very well (at least you should!) Twproject, the wonderful project management software that Open Lab is developing since 2003, which is about to celebrate its fifth major release; finally I can confirm that we will be out at the end of June.

One of the major new features for version 5  is a full Gantt editor, browser based.

I was in charge to select a JavaScript component that we could embed in our product – in order to save time.

So this post is firstly a selection of available components, but …….. read until the end.
(no thanks! I’m in a hurry)

My ideal component should be based on  jQuery, be LGPL (or an equivalent free-free license), be easy to configure, skinnable, multi-browser.

Unlike in my previous articles, when I was looking for grid components, tag inputscalendar, JavaScript templatesconfirm etc., for Gantt editors the market offers few opportunities.


Here is what I found:

DHX Editable JavaScript Gantt Chart

image

This component is very easy to use, simple and well documented.

It supports drag&drop and edit.

In my case the problem was that this component is tightly linked with the DHTMLX library and this is not my choice.

But if you are not already “linked” to a “framework” (like jQuery) maybe this could be your choice.

Regarding licensing, its both under GPL or commercial license. A fee of $699 for an enterprise license may be worth it.


Brynthum EXT Gantt

image

I think this is the best component I found ever.

The user interface is smooth, responsive and well designed. It supports editing in place, zooming, buffering for large Gantt (what could be the meaning of a project with 1000 tasks? Winking smile ) drag&drop etc.

The documentation is well done and complete…… sigh! it is based on EXTJs!

The second negative point is the licensing that doesn’t fit our needs. Only a commercial license is provided.

But if this component fits you, give it a try as it is a great component.


A little sad about leaving EXT gannt, I found

jsGantt

image

this component developed by Shlomy Gantz and Brian Twidt seems a little bit “rude” when compared with the two above, but undoubtedly it has the value of  being built from scratch. No libraries! 100% sweat of the brow!

This component is written for data display, so if you want to drag&drop, edit, interact in some way, you must to write your code.

Documentation is…. concise, but complete.  The license model is BSD.

The lack of the editing ability convinced me to pass over.


jquery.ganttView

image

Finally a jQuery one!

As the name suggests it is only a viewer. Even the data model is a little weak, missing support for dependencies, but is one of the few components I found built upon jQuery. The project seems to be dying and the author Frank Grubbs did not release updates since 2 years ago.

There is an interesting work started from this project http://mbielanczuk.com/2011/06/jquery-gantt-chart/

but it still lacks some features.


I was scraping the bottom of the barrel, when I found this Japanese component

jquery.gantt

image

Done by Maro, this is a very light Gantt viewer; it doesn’t support dependencies, editing or other advanced features, but it can be used as a starting point.


I was really desperate at this point! What I was looking for was something like the component used on

Gantter

image

Gantter is an online service, so not a part of this family of components, but I used it to set my requirements.

They don’t sell their component.


But searching for something similar I found interesting stuff in the far east:

Sunflower 向日葵任务甘特图

image

If you are fluent with Chinese, maybe you’ll find working with this component easier than I did.

But Chinese apart this is a really full featured component, and I work with it for a while. It supports editing, drag&drop, dependencies, zooming, etc.

I didn’t understand the license type very well, but a free version seems available.

Documentation is available in Chinese only, and Google Translate can help you only partially.

It doesn’t use jQuery.


What I found really incredible is how Sunflower component is similar to the one used by the above online service…


And last but not least I found


TreeGrid Gantt Char

image

This component is awesome! really! it can do everything.

Supports every kind of  actions, notation, dependencies, colors, really everything.

There are lots of examples and the online documentation is complete and effective.

imageMaybe someone can argue that the readability of this kind of Gantt is not ideal, but the component can be used in a simpler way.

Scalability is not an issue at all for this component, there is an example with 1000000 rows and 1000 columns!

Also compatibility is wider than any marketer requirement could ever be (runs even on IE6).


Ok it is not based on jQuery, and the commercial license cannot fit every wallet, but a component like this requires years for developing it.


dojox.gantt

image

I have to cite the dojo library for completeness, but I didn’t play with this component.

Seems quite complete and the documentation is well done. Based on Dojo, not on jQuery.

Our solution

If you reached this point maybe you are asking what component did I choose?

I told you at the beginning:


I did it again!

I developed my own component!


Why?

  1. because none of the component mentioned above is LGPL/MIT
  2. none is built in jQuery
  3. I need to actively manage the data model because a Twproject task/project’ one is more flexible than one representable with a Gantt

but mainly because I love to write code!

In this case the work seemed really hard so I  worked in pair with Silvia, and this is actually a nice experience by itself!


Here’s the result of our efforts:

image

Even if the layout is clean and may seem barebones it actually supports a lot of features:

  • in-place editing image
  • drag&drop
  • zooming
  • do/undo
  • multiple dependencies
  • full editing
  • dates shortcuts image
  • css skin
  • multiple browser
  • resources editing
  • multiple assignment
  • milestones
  • export data in JSON format
  • resize & scroll

and

  • tasks status!

the last point is the mayor difference introduced in Twproject task management  model.

Twproject focus is capturing work done in real time. To do this we built a tool that can model real time situations and easily change in time. This is in contrast with traditional project management methodology where projects are defined in advance in all details – not realistic for most work situations.
So Twproject’s model of project, task trees, dates and task states is different from that of classical Gantts: tasks can be open beyond their due dates, task can be suspended inside their time scope, and so on. Also the automation due to dependencies has been somewhat simplified with respect to classical Gantt tools.


The introduction of task’s states lets our Gantt act as a sort of workflow.  Let’s see what happens when you close a phase with dependencies:

here the first phase is open (second row: green-> open)

image


here I closed the first phase (all subtasks become blue->closed : rows 3 and 4 ) so the second phase can start and become green->open and its dependants become orange->suspendedimage


image
Task full editor


image
Resource quick editor


You can try our component online here on http://gantt.twproject.com/

Source code is available on GitHub here. This component is release under MIT license.


In the next post I’ll describe in detail how to use the component code, stay tuned.

The complete link collection for this article is in a Licorize booklet: http://licorize.com/projects/rbicchierai/JS-Gantt-editor

Easy to confirm!

Easy to confirm!

A jQuery confirm plugin

I’m re-writing some components for our  world-wide selling Teamwork, and I was in the need to have a nicer way to confirm some “dangerous” user actions.

The standard JavaScript solution is something like

if (confirm(“do you want to destroy everything?”))
… <em>here the code for destroying</em>

While the code is very simple, the popup alert is unfashionable and old-smelling.

The best solution I found is the Nadia Alramli’s jQuery confirm plugin that I have already used massively in Licorize.

The first great idea in the Nadia’s plugin is that the confirm question is shown exactly where you clicked for the action.

The second idea is that the “confirm” is just “applied after” your code behavior.

Let se the simplest example (from Nadias’ blog):

// The action.
$('a').click(function() {
  alert('click');
  return false;
});
 
// The most simple use.
$('a').confirm();

As you can see, first you bind the event normally, then you will apply the confirm.

This approach is very nice, but its is very “javascript oriented”; what I mean is that you need a js piece of code for setting up the confirm, and this is a little bit rigid for an inline usage.

Example:

<button onclick="destroyAll()">

where “destroyAll” is your function.

So I wrote this little jQuery plugin that can be used like this:

<button onclick="$(this).confirm(destroyAll)">

Here the code:

$.fn.confirm = function(action, message) {
  if (typeof action != "function") return;
  this.each(function() {
    var el = $(this);
    var div = $("<div>")
      .addClass("confirmBox")
      .html(message ? message : i18n.DO_YOU_CONFIRM);
    div.css({ "min-width": el.outerWidth(), "min-height": el.outerHeight() });
    div.oneTime(5000, "autoHide", function() {
      $(this).fadeOut(100, function() {
        el.show();
        $(this).remove();
      });
    });
    var no = $("<span>")
      .addClass("confirmNo")
      .html(i18n.NO)
      .click(function() {
        $(this)
          .parent()
          .fadeOut(100, function() {
            el.show();
            $(this).remove();
          })
          .stopTime("autoHide");
      });
    var yes = $("<span>")
      .addClass("confirmYes")
      .html(i18n.YES)
      .click(function() {
        $(this)
          .parent()
          .fadeOut(100, function() {
            el.show().oneTime(1, "doaction", action);
            $(this).remove();
          })
          .stopTime("autoHide");
      });

    div
      .append("&nbsp;&nbsp;")
      .append(yes)
      .append("&nbsp;/&nbsp;")
      .append(no);
    el.hide().after(div);
  });

  return this;
};

few lines of CSS for the sake of completeness:

.confirmBox{
    display:inline-block;
    z-index:10000;
    vertical-align:middle;
    text-align:center;
    font-size:larger;
    font-style:italic;
    color:#a0a0a0;
  }
  .confirmBox .confirmNo{
    color:#e06060;
    cursor:pointer;
    font-weight:bolder;
  }
  .confirmBox .confirmYes{
  color:#60e060;
  cursor:pointer;
    font-weight:bolder;
  }

and two lines for internationalization:

var i18n = {
YES:"Yes",
NO:"No",
DO_YOU_CONFIRM:"Do you confirm?"
};

See a Demo page here

This component is released under MIT license.

Your feedback will be appreciated.

To JSON or not to JSON

How to simply convert a sqlite database to JSON

Last week my collegue Matteo (aka pupunzi) was porting an iPad application (booo!) to HTML5 (yeah!).

The iPad application was a virtual museum that was using a sqlite dabatase for reading data relative to rooms, biography, history and so on.

Even if sqlite is internally supported by some browsers (e.g. Chrome) the easiest way to read data in javascript is to have a JSON object.

I wrote a simple java code to dump the whole database into a JSON object.

import net.sf.json.JSONObject;
import net.sf.json.JSONArray;
import java.sql.*;
import java.util.List;
import java.util.ArrayList;
import java.io.FileOutputStream;
public class DB2JSON {

  public static void main(String[] args) {

    if (args.length&lt;1)
      return;
    Connection conn = null;

    try {
      String dbFile = args[0];
      JSONObject ret = new JSONObject();
      Class.forName(&quot;org.sqlite.JDBC&quot;);
      conn = DriverManager.getConnection(&quot;jdbc:sqlite:&quot; + dbFile);
      Statement stat = conn.createStatement();

      ResultSet tables = stat.executeQuery(&quot;SELECT name 
         FROM sqlite_master 
         WHERE type=&#039;table&#039; ORDER BY name;&quot;);
      List tableNames = new ArrayList();
      while (tables.next()) {
        tableNames.add(tables.getString("name"));
      }
      tables.close();

      for (String tableName : tableNames) {
        JSONArray jsa = new JSONArray();

        ResultSet rows = stat.executeQuery("select * from " + 
           tableName + ";");

        while (rows.next()) {
          JSONObject row = new JSONObject();
          ResultSetMetaData meta = rows.getMetaData();
          for (int i = 1; i &lt;= meta.getColumnCount(); i++) {
            row.element(meta.getColumnName(i), rows.getObject(i));
          }
          jsa.add(row);
        }

        rows.close();
        ret.element(tableName, jsa);
      }

      conn.close();

      // result on console
      System.out.println(ret.toString());

      //result on file
      FileOutputStream fos = new FileOutputStream(dbFile+&quot;.json&quot;);
      fos.write(ret.toString().getBytes());
      fos.close();     

    } catch (Throwable e) {
      try {
        if (conn != null)
          conn.close();
      } catch (SQLException s) {
      }
      e.printStackTrace();
    }
  }
}

The resulting JSON object will have a property for each table containing an array of records. Different types of properties are supported (String, int, long, dates etc.)

There are two dependencies to external libraries:

  1.  http://json-lib.sourceforge.net/
  2. http://www.zentus.com/sqlitejdbc/

Enjoy.

P.S.: the pupunzi’s porting result is an HTML5 application that runs everywhere and it is looks even more beautiful than the iOS one Smile !

Tassellate: playing on CANVAS

Tassellate: playing on CANVAS

I’ve enjoyed so much playing on HTML5 <CANVAS> that now I cannot stop…


(test demo here)

Now I’m playing on a component that I’d like to use as replacement for the current “weekly review” game on Licorize. If you are wondering about a “game” on a GTD operation like “weekly review”, have a look at Game mechanics for thinking users article by Pietro Polsinelli.

The goal is to transmit the idea of having something to be “cleared”; a picture covered with black pieces should work fine!

The requirement is that the number of pieces covering the image must be pre-determined.

First of all I need an algorithm to “tassellate” the image with random shaped triangles. Actually the triangles are not overlaying, so I divide recursively the space available.

Go have a simple algorithm, first I split the image in two triangles, then I apply to both the recursive splitting.

A single splitting step:image

1) choose a random side

2) find a point (x) on that side, nearly in the middle

3) link the point (x) with the opposite corner and generate two triangles

4) apply splitting on both triangles

here is the code:

image

Then the recursive function: notice that I have to use a queue to “balance” the recursion on both splitted parts, otherwise I will divide only the first triangle reaching the exit condition (x pieces reaced).

image

Then I used my simple Stage object to manage canvas interactions (read lenscape a canvas interaction tutorial for details) as click on triangles, mouse over, etc…

I’ve also added a sound on “remove piece” button, but dealing with the <AUDIO> tag is another history…

JavaScript grid editor: I want to be Excel

A short list of my favorite JavaScript grid components.

How many times did you hear users asking you: “something simple, a grid like excel”?

When I was a VB programmer, oh yes, I have this dark spot on my career, and it is not the only one… this request threw me in panic. Usually what your “killer” is asking you is not what you, programmer, are thinking of (namely the power of cell functions, programmability, graph etc., that probably your “killer” does not even imagine): what they are thinking about is the editor flexibility, the ability to add columns, rows, move cells blocks, copy and paste from different sources.

After the ritual pointing-out that your application is NOT Excel, the VB solution was to adopt the standard flexGrid or the mythical TrueDbGrid that made happy both the killer-user and the victim-programmer.

But my VB era is long gone and nowadays I’m fighting with JavaScript and Java web applications; how to address the same old request of “something like Excel”?

I spent some days looking around for a solution. I warn you that this post does not pretend to be a complete list of available grid/table editors and that my investigation is mainly  “emotional”: I want to feel on a web-app the same prickle that I experience when using Excel.

Of course it is not only romantic surfing, I needed to edit data to fill the graph snipplet for Patapage, so there are some “nice to have” requirements: to be free of charge, light, based on jQuery, appealing. Server side aspects as pagination, sorting, CRUD etc. are for the moment not the crucial points as the amount of information I need to manage is limited and a totally client side solution would be acceptable.

Actually the implementations I found can be classified in three main groups:

  1. data driven: these are generally components with all the features needed for listing a large number for rows, with server-side pagination, scrolling, search and sort functionality; generally are lacking editing functionality, or when the feature is present is single row based, reflecting the fact that there is an underlying database. Data binding is made through XML or Json, depending the language supported server-side
  2. light edit: here the focus is given to the “editing agility”, every row is always in editing status,  search and sort are rarely available and in any case working on a limited set of rows isn’t a real limitation. Data is filled starting from a JS object, calling methods, or from an html table.  Some of these implementation supply callback methods that can be used to interact server side.
  3. spreadsheets: oh yes! there are also some really sophisticated JS clones of the glorious one! These are generally  complex solution (in terms of dependencies), supporting formulas, graphs and lot of functionalities. Here the focus is the “simulation effect”, data management and server side integration are really in background.

When I started my search I didn’t imagine that there were so many solutions, so I decided that it would be better here to limit the result to the ones based on jQuery. Lets go in depth :

Data Driven

One great example of this category is jqGrid by Tony Tomov. This is a really well engineered solution released under MIT and GPL licenses.

imageSupports pagination, search, sort and even edit. There are two specific versions for PHP and .NET that drastically reduce the server-side implementation effort. Loading data is supported in multiple ways through XML, JSON or JS arrays and examples are supplied for PHP and MySql. There is a third party Ruby example here.

It uses jQuery.UI components for display, so the look and feel is pretty.  Switching to edit mode is something perceivable, the user will see that the edit is active, but this is not necessarily bad in this class of components.

It supports sub-grids, multiple input types, master-detail, multi-selections and other useful features.
Column configuration is done in a declarative way using JS objects:

colNames:['Inv No','Date', 'Client', 'Amount'],
colModel:[ {
  name:'id',
  index:'id',
  width:55,
  editable:false,
  editoptions:{readonly:true,size:10}
},…

that gives you the flexibility you need for well tailored applications.

Seems a rock solid components, the behavior in resizing, scrolling, paging is really pleasant.

Documentation is not the strongest point but there are lots of examples that will help setting up your grid.

by Allan Jardine released under GPL v2 and BSD is a powerful data grid component.

image

Supports pagination, resizing, filtering, multi-column sorting, jQuery UI theme roller, and lots of interesting features.

Data feeding is provided a-la-carte, from DOM, Ajax XML or JSON sources, JS arrays… it’s your choice!

There is also the icing on the cake: cells and rows grouping, cell custom renderer, multi-row selection and much more.

Provides cell editing via jEditable cell-by-cell, not a row at once, and this in some cases could be a limitation; so you may need more that one update to change a row. Probably you can work around this trivia-point.

Configurations starts from zero-config in case of DOM feeding and can be refined to a real full-control using JS objects.

It is well-documented with a large set of examples and this is another plus!

A black spot (at least for me, Java programmer): server side examples in PHP only.

Another valid example is Flexgrid by

What I really appreciated in this component is the lightness and its simplest feeding example based on an html table. In this case  the whole setup consists of:

$(“#mytable”).flexigrid();

image

Of course this is a quite minimalist approach to this component that supports also XML and JSON data feeding.

Paging, sorting, resizing and other nice features like button injection are supported.

What is missing is the edit capability that is planned but still not released.

Similarly to the previous component the configuration (if needed 😉 ) is done by JS objects.

Documentation: we all are programmers, we hate to write it but we love to read it… so here too is really succinct with few examples for PHP server-side both XML and JSON.

tgrid by Mateusz Mikołajczyk is a lightweight datagrid, that supports all main features like sorting, paging, filtering.

image

I didn’t discover the license type so be careful on usage.

Data is fed by Ajax Json calls that make this component scalable enough.

Documentation supplied is “short” but with some examples, so setup is not a big deal.

This components supports a “row rough” edit, in the sense that it is not in-place, but out of the grid: it did not give me the right feeling. Taken out the edit, tgrid runs well.

Configuration does not offer many options; something nice is the cell custom renderer that allows you to format data.

Ingrid (great name!) is a less powerful grid component, but it is really unobtrusive and cute enough to be considered. Released under GPL license, it supports column resizing, sorting, paging etc.

image

Data is fed only by providing an html table, and this could find some criticism.

Google Chrome support has some little creeps on display.

Multiple row selection is a nice feature that earns some points to this component.

Editing is not supported.

In the same spirit of loveliness jTps by Jim Palmer is released under MIT license.

image

Paging, resizing, sorting are supported; a nice feature is smooth scrolling. Even in this case editing is not supported, but the real limit of this component is in term of scalability: data feeding does not support Ajax sub-sequential loading, so all data is loaded at once. Paging is only client side limiting the meaning of this feature.

Same category for dhtmlxGrid by DHTMLX.

imagedhtmlxGrid is a JavaScript grid component with editing capabilities, and server-side data binding. It is a powerful component with so much advanced features (such as filtering, searching, grouping, charts integration, math formulas, etc.) that it could be included in “Spreadsheet” group too 🙂

dhtmlxGrid is distributed under GNU GPL v2, but also available under a commercial license.

It is built over a “dhtmlxcommon” js library instead of most famous jQuery or Prototye libraries, but this is not a big deal if you need such powerful component.

For the sake of completeness I have to cite TableEditor by Brice Burgess that seems a little bit outdated (even if really well indexed), and Snowcore’ jQuery Data Grid that is in Russian and this fact did not help me to understand how to use it; moreover the site icon noie let’s me suppose that IE testing is not a priority for Snowcore 🙂

Light Edit

This category, as before stated,  is mainly focused on edit agility instead of server-side data management. This fact steers the implementation towards a all-client-side approach. Implementations in this category are generally a little bit rough with respect to the previous ones.

imageA  real interesting exception is the excellent SlickGrid by Michael Leibman released under MIT style license.

Here the author is particularly careful in rendering performance; he uses a virtual rendering technique to limit the number of DOM elements in order to make SlickGrid really scalable. The example provided with 50000 rows really run in a flash.

The author states in the “grid vs data” paragraph that here the focus is on the grid, not on the data. Despite his intentions, sorting, resizing, filtering, resizing and edit callbacks, give this grid a place even in in the previous category.

Data feed can be done via JS arrays, or via Ajax using the Slick.Data.RemoteModel object provided.

imageCustom cell renderer allows you to express your creativity, as shown explicitly in the examples when injecting a Sparkline graph in the last column (see my previous post for a excursus on charting components).

Rows multi-selection, ordering, and custom row rendering using John Resig’s micro-templates makes this component really flexible.

Configuration is done as usual using JS objects.

Having all this features and also having taken care of cell movements with the keyboard and easy editing is a great achievement!  Thanks Michael.

Once again Allan Jardine provides us a useful tool called keytable that injects Excel-like key movement on a generic table.

imageThis can have multiple usages as exemplified on demos available on the site. It easy to understand how a key-movement can change the user experience when it is used on a powerful grid component like DataTables (see above). Here the author’ example.

Another really basic example of editable table is supplied by Greg Weber with uiTableEdit: there are no examples online, so I built a simple test page, and the components just add the capability to change the cell value. No key movement or other additional features are handled; it can be used as starting point for further refinement.

imageSame kind of “roughness” for tEditable by Josh Hundley, where edit is click based, and key-movement is not supported. This do not mean that this tools is useless, just that it is really far from a complete solution.

It converts DOM cells to text-areas on the fly when editing, and this makes this component almost setup-free.

A part of this category (the rough part 🙂 ) is my contribution, used to fill data on PataPage’ charting playground.

image image

Here the functionality are really basic: key-movement, edit, load from url, add and remove only are supported. The grid content is “saved” on a text area with \t and \n separators: same format expected when loading from url. I’m working for supporting  the ^v (paste) capability to facilitate user data insertion as block of cells.

Spreadsheet

Actually this category comprises solution wider than previous ones, in the sense that a complete solution will probably include all the features listed before; this is on one side a plus, but on the other side if you are interested in extracting some parts (e.g. table edit but not on formulas, server-side integration but not on key-movement etc.), this could be a little difficult due to the complexity of the solutions available.

Light years beyond other solutions at least as first impression, jQuery.sheet by Robert Plummer is a really wonderful library. I didn’t find the license type.

image

Really looks like an Excel sheet and the key-movement seems realistic.

Data feeding is done using a DOM table, eventually Ajax-loaded, or by adding row and cols programmatically.

The grid supports resizing, but the real wondering feature is the cell-function support. Not limited to SUM, AVG and other standard functions, but also chart are allowed.

Lots of callback will help you to integrate the sheet on you application.

There are some little bugs on cell selection and some minor layout issue with Chrome, but the overall behavior is impressive.

The last, but definitively not least, example of websheet (a web spreadsheet) is the Googledocs one. It is a really good live-teaching example, and even if it is not a ready-to-use library I suggest you to open it and dissect it with, for instance, Firebug.

It is interesting to see how many tricks they used: the whole grid is one iframe, the rows are grouped in small tables of 20 rows (probably in order to scale on IE), the cell value is stored in the td dom; when you edit a cell a text area is printed over the cell (not inside), and so on.

I tried to implement my grid using the same structure, but after some hours I surrendered; the effort to “master” the layout was over my actual estimation, and I fell back to the solution discussed above.  Would be gorgeous to have a jQuery open-source implementation like this!

Google docs spreadsheet is the only application I found that gave me  the right prickle!

Well I stopped my searching here, and I didn’t explore Mootools, Sriptacolous, Ext and maverick ones in detail.

There is a booklet for this blog post here on licorize.com. (Licorize is one of my latest creations, please take a look)

I’ll just list here some other libraries I found:

Spreadsheet Dojo Widget image

image

Ext JS DataGrid

YUI 2 DataTableimage

Simple Spreadsheetimage

BlueShoes SpSpeadsheet editor image

TrimSpreadsheet image

Sigma Grid 2.2image

JavaScript charting tools: an overview

Tons of charting tools, one better than the other, how to find yours?

I was working on adding a new widget for Patapage. Sometime you need to publish a simple graphical report on your page, a chart, based on a small set of data that you may want to change quickly online.

As requirements, I wanted to have an immediate feedback of data and configuration changes so I chose a JavaScript charting tool instead of server-side generating “chart images”.

Few years ago this approach was almost impossible due to the lack of cross-browser plotting libraries. Nowadays  there are many powerful plotting tools: this article will introduce some of them and will explain how I got to choose my plotting library.

First of all I had to restrict the selection to those that are licensed for usage in a commercial products, but this is not a big deal; most of them are under LGPL, or MIT license.

imageMy second requirement was the compatibility of the JavaScript library: we use jQuery so I had to drop the great plotr library that is based on prototype.

Actually Solutoire has also a Prototype porting of flot called Flotr.

imageSame technology for Protochart. For the same reason I quit in tears the amazing jsxgraph. What I loved of this library is the universe of interactive examples provided by the community. If you do not have library restrictions have a in-depth look to this jewel (if it doesn’t fit, give yourself at least a recreation playing for few minutes with the examples 🙂 ).

imageAlso Raphael is a real impressive product, but even in this case it doesn’t relay on a “standard” JavaScript library, and mainly it is a low level vector library, in the sense that it doesn’t supply any specific chart plotting functions. If I had to write a graph library from scratch I’ll probably start from here.

imageMooTools user will have on their side moochart or canvas pie.

image

For jQuery fanatics, like me, there are lots of bullets too.

image

First I started having a look at the flot library. I was astonished to see how well engineered this library is . IMHO one of key point is that the whole configuration is defined by using a JavaScript object, so a basic example that will produce the cart on right side will look like:

<script>$(function () {    var d1 = [];
    for (var i = 0; i < 14; i += 0.5)
        d1.push([i, Math.sin(i)]);
    var d2 = [[0, 3], [4, 8], [8, 5], [9, 13]];
    // a null signifies separate line segments
    var d3 = [[0, 12], [7, 12], null, [7, 2.5], [12, 2.5]];

    $.plot($("#placeholder"), [ d1, d2, d3 ]);
});
</script>

This approach is very practical when you work with json objects, especially for data series. Another nice aspect of this library is that series configuration and data are on the same object. Of course when you need to use advanced charting features (time series, label formats. ticks etc.) the configuration will become quickly complex and not really readable, but on the other hand the basic approach is straight and painless. Unluckily flot at this moment does not implements pie renderers (to be honest there are some  implementation from the community – see flot issues), and this was one of my widget requirements. Another little spot is the documentation that is complete but really ‘60 stylish. Even the examples are a bit poor but enough for starting quickly.

image Then i moved to Sparklines that is a very easy-to-use and intriguing library; I like their site with lots of small charts.  If you need to create dashboards for your site have a look at this plugin. Even in this case configuration and data uses a JavaScript object.

Sparklines was a little basic for my needs so I tested TufteGraph and   jQuery Chart; I found both lacking in features.

Then I landed in the jQuery Visualize Plugin from Filament group; they have a really smart idea; leave the data on a HTML table!

So the data will look like

image

imagethen the configuration is done as usual by passing  a JavaScript configuration object to the drawer function. On their site there is a nice sandbox to try configuring your chart.

If you already have table displaying data just add a line of code to have your chart.

Of course this is a completely different approach from flot, where to have the same visual effect you must write tons of lines; on the other hand jQuery Visualize does not give you complete configurability, but only reasonable ones 🙂 . In most cases this could be an effective approach especially if you do not like to spend hours with JavaScript objects and arrays.

I didn’t stops at this station. Next stop jqPlot!

image jqPlot is a really well engineered solution, in some sense it has an approach similar to flot, but it has more plotting types (pies too!), a great documentation online and a lot of examples.

Here both data and configuration are JavaScript objects but are separated, two parameters on the drawing calls.

I appreciated the “default renderer” configuration so you do not need to write too much in case of multiple data series (unlike flot).

The other key factor of this library is the complete pluggability of the renderer; you can have renderers for axis, labels, ticks etc. This approach for instance makes it possible to have labels rendered by canvas:

image

The separation between data and configuration helped me to realize my Patapage widget.

imageI made an editable table that refreshes on-the-fly chart values and a set of options to change the graph layout. Both data and configuration are serialized, so to be easily stored server-side.

I have set up a playground in order to test my Graph component, that covers only few of  jqPlot features, but should give you an idea about this component.

For the sake of completeness I have to cite Google Chart API and  Yahoo YUI Chart Controls, that require to bind tightly with these too small players 🙂 . No thanks, next time maybe.

well engineered

Solving the “halting problem”…

When I asked Gino (alias Roberto Baldi mostmobbed) a software solution for the “halting problem”, he told me “should not be so difficult”!

“In computability theory, the halting problem is a decision problem which can be stated as follows: given a description of a program and a finite input, decide whether the program finishes running or will run forever, given that input.” (from Wikipedia)

Alan Turing proved in 1936 that a general algorithm to solve the halting problem for all possible program-input pairs cannot exist; but as Gino says, Turing was a pessimist…

Why I’m scratching about the halting problem? Because I need power at BugsVoice user’s fingertips. In particular, I need to allow the execution of user’s JavaScript code on my server, and knowing if these scripts end may be comforting.20080102_9458

If you already heard about XSS  you probably know that “third party” code execution, authorized or not, could be a nightmare even in the client… can you imagine how can be ugly on your server a “pirate” code?

Going more in detail, BugsVoice is a service that receives a “bug” from a customer’s server, process the request locally, serves a friendly feedback to the user and stores the bug in its database.

JavaScript (JS from here on) server-side execution is involved in the “processing” phase.

We supply a pre-filled and certified set of “rules” for processing bugs, but we even allow customers to create their own rules.

JS gives you the power of inspecting the error to understand what happened and gives your customer an error better than a “500 server error” in order to comfort it and recover a situation where your application credibility is going down. An interesting reading about error recovering and error feedback is  the book “Defensive design for the web” from 37 Signal.

The complete BugsVoice process includes mainly three parts:

1) on the customer’s server side,  an error page that catches the exception, collects as much information as possible (logged user, time, server status, database status, memory etc.) and redirects the user to our BugsVoice server (see how to configure an error trapping page on BugsVoice blog for more details).

2) our server, reading user preferences recovers the error template. Each template is fully dynamical and customizable; it introduces some “variables” that can be filled from the error happened. Then our server creates two JS objects: the “bug” object filled with the error collected and the “template” object filled from layout skeleton.

3) the JS rules are executed to fill “template” from “bug” or for rejecting the request.

4) the layout is rendered to the user by  using “template” and “bug” objects. The bug is stored on our server.

5) the user feedback is collected and stored.

6) a “thank you” page is displayed to the user.

Then there is the error management but this is interesting “only” for BugsVoice’ users, not for this post. Here some error pages from BugsVoice:

image image image image

So every user can create its own rules in order to inspect, for instance, the received bug’ stacktrace trying to discover if a database problem happens, or if there is a problem with the latest version of  some browser.

Coming back to rules execution:
during step 3) we get rules from the user configuration and we execute them on our server. We use the Java SE 6 scripting features supplying an ECMAScript engine to run rules.  A scripting engine instance is isolated from the JVM environment and you must declare the resource (libraries) you want to made available in the execution context.

Before executing them, the context is fed by “bug” and “template” objects. Then we run the rules…(drum roll!).

A basic (and friendly) rule example :

if (bug.code==404)  errorPage.errorMessage="Page missing: you get this error because of...";

Of course this code is safe, but what happens if an evil user composes a pleasant rule like

while(true);
or
function snake(s){
  return "s"+snake(s);
}
snake(":-<");

… or even worst?

Sadly Turing beats Gino 1-0, and there is no general solution to the question “does this rule ends?”.

The only possible solution is to narrow the scope of the problem by introducing some fences.

A solution is to set up an external observer using  multi-threading and watch dogs in order to kill processes after a while, but the best solution is to avoid infinite loop situations.

Rules in our context are used mainly for discovering string patterns in the error stacktrace and for building better feedback; we do not need to iterate or create complex functions, so reducing the set of possible JS statement is possible without loosing “power”.

Luckily in JS there is a limited set of statements for iteration and recursion; so if we are able to “kill” bad intentions by forbidding dangerous statement like “while”, “for” or function definition we can run rules with confidence.

This way  we reduce the complex halting problem to the (quite) easy problem of  HTML sanitization  (where you must  remove some unaccepted tags. See XSS war: a Java HTML sanitizer ).

Actually identifying “while” or “for” statements in a complex code is not as easy as finding the “while” string. The find/replace approach  it’s too rough, and here we need a more accurate solution in order to understand the difference between

while (true);

and

var dummy= “while(true)”;

that is obvious for us but not for a string searcher…

You must use something to analyze the code token by token.

ANTLR 3 supply all you need for tokenizing, parsing and walking your code. You need a JS grammar and then ANTLR will build all the stuff. We used the ES3 grammar from Xebic Reasearch  (BSD license) based on the original work of Patrick Hulsmeyer, that fits perfectly our needs.

With the AS3 grammar we built  parser, lexer and walker to analyze rule’s code to intercept every forbidden statement and avoid accepting dangerous scripts (at least I hope this). Only the rules that pass the test will be saved on the system and will be available to the script engine.

Ok, I can confess you, the post’ title is a little misleading, there is no way to solve the halting problem at least without cheating!